Macro Theme:
Key dates ahead:
- 11/5: ISM
- 11/6: Jobs
- 11/14: PPI
- 11/19: NVDA ER
SG Summary:
10/31: Yesterday’s meager 1% decline started to ease the “risk alert” positioning we flagged on 10/29, with call skews shifting to “rich” vs “screaming overbought”. Thats good news for bulls, as we think there is less spasm risk (a la 10/10). On the flip side, we are not seeing any obvious long opportunities, either. Bottom line: We hold the VIX call spread hedges we bought earlier this week, but with a close back >6.900 we’re back into a risk-on stance.
10/29: RISK ALERT – COR1M and the over-bid Index calls have us quite nervous at these levels. Given that we are going to be rolling up call positions, and adding to downside protection. The trick is maintaining long exposure while legging into some ~1-month protection. We will look to get more aggressive if/when downside starts to flare.
Key SG levels for the SPX are:
- Resistance: 6,800, 6,900
- Pivot: 6,900 (bearish <, bullish >)
- Support: 6,700, 6,600
Founder’s Note:
Futures are flat. JOLTS 8AM, Jobless Claims 8:30AM ET.
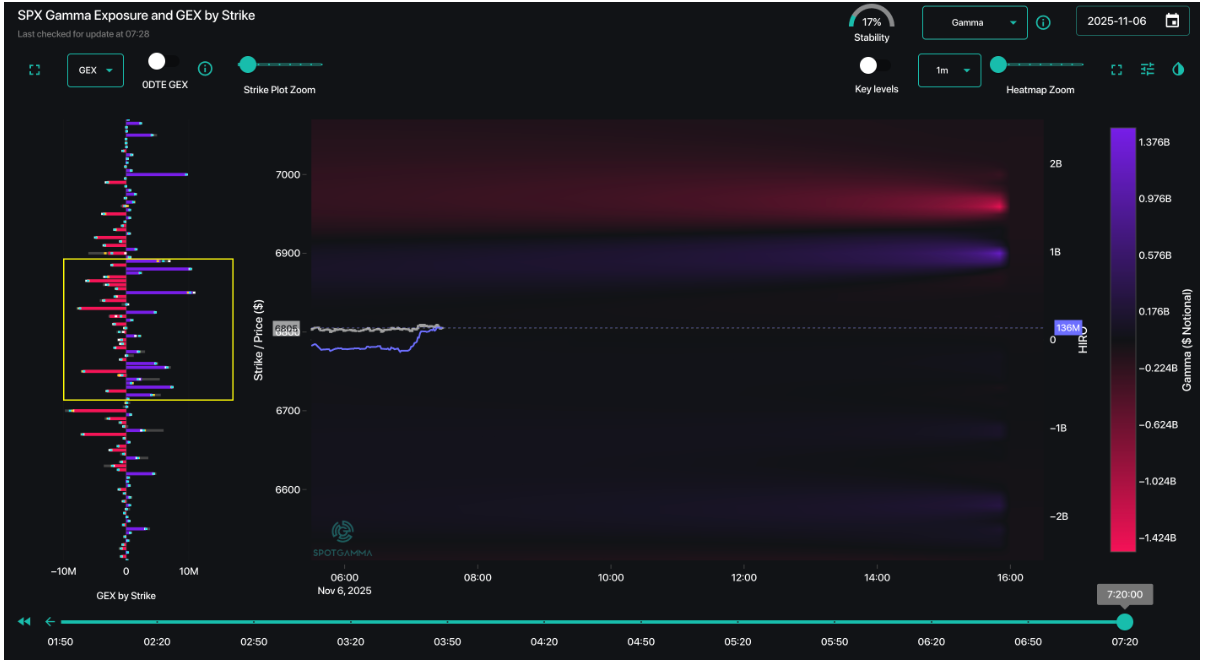
“Transient moves” are clearly the regime, after seeing strong early market rallies give may to afternoon mean reversion. The current gamma structure is, in a word, “sloppy” (see yellow box & black TRACE map around ATM), which should read to more of the choppy, transient movement seen in resent days. We use the term “transient” because the flows that are slow dominant at one time/hour of the market, disappear ay another time/hour (generally 0DTE). Given this, we will continue to watch
HIRO
to decode intraday movement, with trending positive/negative
HIRO
values strong indications of higher/lower equities.
Again, as said many times the last few days, we are treating moves as intraday swings until we regain some meaningful positive gamma and/or vols normalize further (ie VIX ~15-16).
What can be said about this market is that vol didn’t escalate in a meaningful way, and downside has so far been contained. We highlighted this in detail yesterday AM, and note the prime feature of yesterday’s (initial) rally was a slamming of vol. Those vols slid a bit higher as the SPX closed weaker, but the general idea of vol lower is still in tact (below is Monday SPX IV vs this AM). The takeaway is this: volatility as an asset class is a key driver here, meaning the opportunity to sell vol is on many traders minds. If/when they get active selling vol, it pushes SPX higher. That being said, market structure is not supportive of a meaningful sticky/multi-day trend until SPX finds some positive gamma – a dynamic that still likely rests >6,900.
On the topic of vols, we had +90th %’ile skews just 1-2 weeks ago, and that over-bid has faded. Interestingly, we see AMD calls are now bid out of their earnings event, and there is still a bid into NVDA & AVGO which report 11/19 & 12/11, respectively. This matters because it suggests the AI/Semi story remains in tact – and that is the key driver of positive market sentiment. These equity vols are now not such an obvious sell – but also not yet an obvious buy, either. We bet a fatter pitch evolves here (on dynamic of price/vol), particularly if we have another few days of chop.
©2025 TenTen Capital LLC DBA SpotGamma
All TenTen Capital LLC DBA SpotGamma materials, information, and presentations are for educational purposes only and should not be considered specific investment advice nor recommendations. Futures, foreign currency and options trading contains substantial risk and is not for every investor. An investor could potentially lose all or more than the initial investment. Risk capital is money that can be lost without jeopardizing one’s financial security or lifestyle. Only risk capital should be used for trading and only those with sufficient risk capital should consider trading. Past performance is not necessarily indicative of future results. VIEW FULL RISK DISCLOSURE https://spotgamma.com/model-faq/disclaimer/
|
|
/ESZ25 |
SPX |
SPY |
NDX |
QQQ |
RUT |
IWM |
|---|---|---|---|---|---|---|---|
|
Reference Price: |
$6798.85 |
$6771 |
$675 |
$25435 |
$619 |
$2427 |
$241 |
|
SG Gamma Index™: |
|
0.059 |
-0.342 |
|
|
|
|
|
SG Implied 1-Day Move: |
|
0.63% |
0.63% |
|
|
|
|
|
SG Implied 5-Day Move: |
|
1.39% |
|
|
|
|
|
|
SG Implied 1-Day Move High: |
|
In PM note |
In PM note |
|
|
|
|
|
SG Implied 1-Day Move Low: |
|
In PM note |
In PM note |
|
|
|
|
|
SG Volatility Trigger™: |
$6822.85 |
$6795 |
$675 |
$25520 |
$621 |
$2450 |
$246 |
|
Absolute Gamma Strike: |
$6027.85 |
$6000 |
$670 |
$24500 |
$630 |
$2450 |
$240 |
|
Call Wall: |
$7027.85 |
$7000 |
$700 |
$24600 |
$650 |
$2600 |
$250 |
|
Put Wall: |
$6727.85 |
$6700 |
$670 |
$24000 |
$600 |
$2380 |
$240 |
|
Zero Gamma Level: |
$6759.85 |
$6732 |
$679 |
$25371 |
$627 |
$2495 |
$250 |
|
Key Support & Resistance Strikes |
|---|
|
SPX Levels: [6000, 6800, 7000, 6700] |
|
SPY Levels: [670, 680, 640, 675] |
|
NDX Levels: [24500, 24600, 25500, 25000] |
|
QQQ Levels: [630, 600, 610, 625] |
|
SPX Combos: [(7103,95.07), (7076,72.79), (7049,89.81), (7022,90.32), (7002,99.57), (6988,67.90), (6975,84.68), (6968,83.69), (6948,97.44), (6927,89.41), (6921,81.58), (6907,70.66), (6900,98.79), (6887,82.66), (6873,90.85), (6860,82.12), (6853,97.50), (6839,74.43), (6832,76.81), (6826,86.68), (6819,83.18), (6799,84.78), (6772,79.14), (6765,82.25), (6758,74.06), (6751,91.63), (6738,85.31), (6731,83.74), (6724,80.54), (6717,93.46), (6711,78.84), (6697,96.54), (6690,82.52), (6677,90.19), (6670,87.17), (6663,75.55), (6656,67.41), (6650,88.76), (6643,74.89), (6616,81.10), (6602,84.36), (6548,78.20), (6528,73.94), (6514,74.23), (6501,93.15), (6467,82.11), (6453,74.49)] |
|
SPY Combos: [698.4, 688.15, 692.94, 685.42] |
|
NDX Combos: [25258, 24647, 24596, 25054] |
|
QQQ Combos: [640.28, 637.75, 635.22, 649.76] |

0 comentarios