
Macro Theme:
Key dates ahead:
- 5/15: OPEX
- 5/19: VIX Exp
- 5/20: NVDA ER
SG Summary:
Update 5/12: We like owning June VIX calls as a hedge with Oil going >100. We also like put flies/ratios etc in the highest flying tech names (AMD, SNDK, MU, etc). These ideas are in the context of larger equity market support/volatility suppression from 5/15 OPEX to 5/20 VIX Exp/NVDA exp. Following that we look for a larger market move to come into play.
5/6: Markets seem to pricing in an Iran deal as oil is down 9%, but nothing concrete has been announced. Regardless, between the AI-earnings beats, and oil<100, its clear that a general vol decline and continued stock support should remain in tact through to OPEX 5/15. The removal of Iranian tail risk will only aid to stock support (vanna).
Key SG levels for the SPX are:
- Resistance: 7,420, 7,450
- Pivot: 7,340 (bearish <, bullish >) updated 5/14/26
- Support: 7,390, 7,350, 7,300, 7,280, 7,250
Founder’s Note:
Futures are up 30bps, with WTI at 100, and the VIX <18.
With OPEX tomorrow, we are not expecting much movement out of the SPX for today. 7,500 remains major resistance in to 5/15 – and more likely in through NVDA ER on 5/20. Major support is at 7,400, then 7,350.
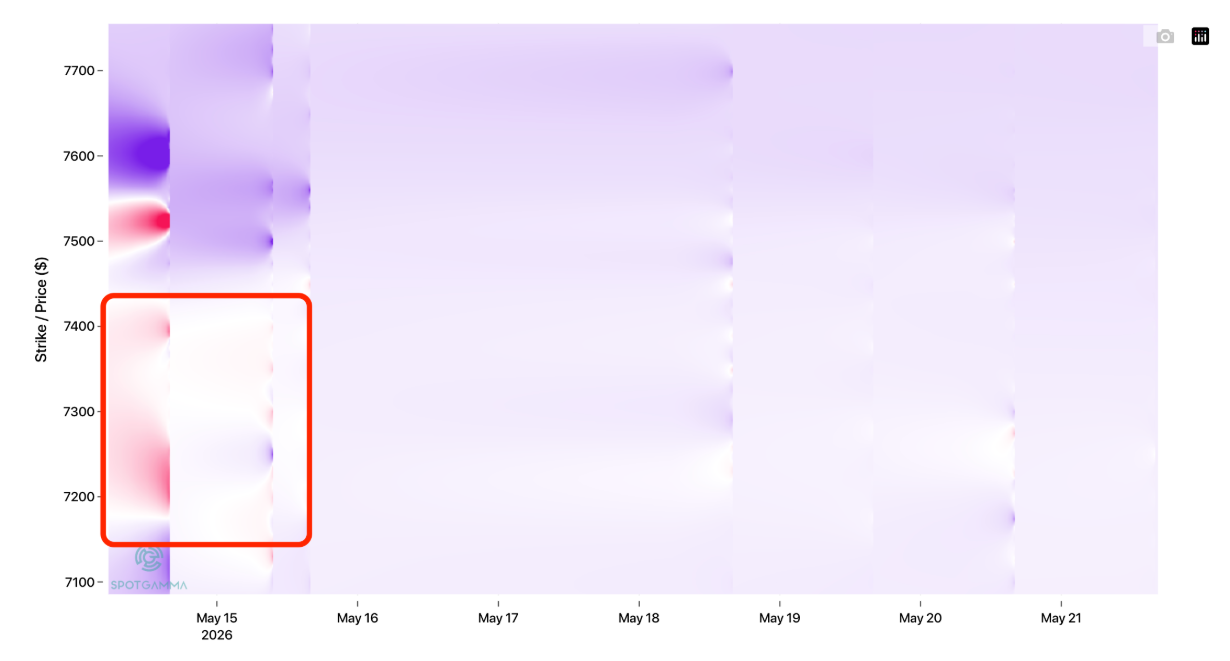
TRACE is currently implying some softness in the SPX if the SPX probes <7,400, as you can see via the localized negative gamma. However, OPEX appears to clear this negative gamma out, leaving a light positive gamma position to start next week. Obviously these dynamics change quickly as the 0DTE crew wakes up – but for today into tomorrow it is a dynamic to watch.

The overall picture remains that we think realized vol should continue to contract into NVDA on 5/20. SPX 1-month realized vol is at 10%, which is the lowest its been since late Jan early Feb. Should the Iran deal actually be resolved, then we may see the VIX quickly go to 15 to match up with this tame realized vol. That said, without a deal what we think happens is NVDA opens up a period for higher volatility (remember, volatility works to the upside and downside).

In yesterday’s OPEX video, we discussed the idea that our options metrics were not yet screaming “overbought”. In a perfect scenario, NVDA would release a final surge, which would place metrics like COR1M into the fully-overbought signal.
Consider the dispersion trade, and the CBOE DSPX metric (black line, bottom chart). It’s making ~1-year highs due to traders bidding up call options in big tech. DSPX essentially measures the spread between single stock IV and SPX IV. Its making highs despite the fact that SPX IV has been sticky due to 1) surging SPX upside and 2) some event-vol premium (Iran). More positive news on the NVDA and/or Iran front would like put a bit into single stock tech, and drive the index vol down, suggesting more profits for the dispersion crowd. This could trigger a final surge into overbought.
Seeing both sides, inflation measures are ticking up, and its possible NVDA simply “meets” and/or Iran goes the wrong way. In that case, there is enough of a strong bid into calls that an unwind of rich calls could create some strong equity downside. To hedge such an event, we like VIX slightly OTM calls for June. We think the carry on those can also be favorable through NVDA ER, as positive NVDA ER.

©2025 TenTen Capital LLC DBA SpotGamma
All TenTen Capital LLC DBA SpotGamma materials, information, and presentations are for educational purposes only and should not be considered specific investment advice nor recommendations. Futures, foreign currency and options trading contains substantial risk and is not for every investor. An investor could potentially lose all or more than the initial investment. Risk capital is money that can be lost without jeopardizing one’s financial security or lifestyle. Only risk capital should be used for trading and only those with sufficient risk capital should consider trading. Past performance is not necessarily indicative of future results. VIEW FULL RISK DISCLOSURE https://spotgamma.com/model-faq/disclaimer/
|
|
/ESM26 |
SPX |
SPY |
NDX |
QQQ |
RUT |
IWM |
|---|---|---|---|---|---|---|---|
|
Reference Price: |
$7466.9 |
$7444 |
$742 |
$29366 |
$714 |
$2843 |
$282 |
|
SG Gamma Index™: |
|
5.673 |
0.176 |
|
|
|
|
|
SG Implied 1-Day Move: |
|
0.62% |
0.62% |
|
|
|
|
|
SG Implied 5-Day Move: |
|
1.55% |
|
|
|
|
|
|
SG Implied 1-Day Move High: |
|
$7505.04 |
$748.37 |
|
|
|
|
|
SG Implied 1-Day Move Low: |
|
$7412.56 |
$739.15 |
|
|
|
|
|
SG Volatility Trigger™: |
$7317.9 |
$7295 |
$737 |
$28490 |
$713 |
$2780 |
$282 |
|
Absolute Gamma Strike: |
$7022.9 |
$7000 |
$740 |
$29000 |
$700 |
$2800 |
$275 |
|
Call Wall: |
$7522.9 |
$7500 |
$745 |
$30000 |
$725 |
$2785 |
$285 |
|
Put Wall: |
$7412.9 |
$7390 |
$730 |
$27500 |
$700 |
$2750 |
$275 |
|
Zero Gamma Level: |
$7257.9 |
$7235 |
$735 |
$28423 |
$707 |
$2837 |
$284 |
|
Key Support & Resistance Strikes |
|---|
|
SPX Levels: [7000, 7400, 7500, 7450] |
|
SPY Levels: [740, 745, 735, 750] |
|
NDX Levels: [29000, 30000, 27000, 29400] |
|
QQQ Levels: [700, 710, 715, 705] |
|
SPX Combos: [(7802,95.29), (7772,67.21), (7749,87.72), (7727,73.93), (7697,96.17), (7675,88.44), (7653,93.69), (7623,91.80), (7601,99.30), (7593,67.81), (7578,95.14), (7571,87.13), (7563,92.71), (7548,97.89), (7541,87.37), (7534,93.92), (7526,99.49), (7519,99.43), (7511,92.87), (7504,88.57), (7496,99.93), (7489,92.78), (7481,98.35), (7474,98.55), (7467,96.39), (7459,91.26), (7452,99.72), (7444,67.87), (7437,77.98), (7429,85.32), (7422,97.50), (7400,98.92), (7392,92.23), (7385,82.79), (7377,77.76), (7325,70.94), (7318,67.23), (7303,83.36), (7117,68.25), (7102,76.74)] |
|
SPY Combos: [747.8, 738.2, 743.37, 740.41] |
|
NDX Combos: [30013, 29807, 29602, 29514] |
|
QQQ Combos: [729.83, 710.03, 719.93, 710.74] |
|
|
SPX |
SPY |
NDX |
QQQ |
RUT |
IWM |
|---|---|---|---|---|---|---|
|
Gamma Tilt: |
1.699 |
1.189 |
1.981 |
1.136 |
1.014 |
0.792 |
|
Gamma Notional (MM): |
$1.377B |
$431.393M |
$14.50M |
$162.815M |
‑$1.182M |
‑$280.441M |
|
25 Delta Risk Reversal: |
-0.04 |
-0.021 |
-0.04 |
-0.022 |
-0.043 |
-0.028 |
|
Call Volume: |
1.143M |
1.605M |
15.45K |
1.043M |
17.721K |
215.931K |
|
Put Volume: |
1.073M |
1.92M |
13.194K |
1.258M |
28.758K |
639.271K |
|
Call Open Interest: |
10.016M |
6.195M |
92.984K |
4.737M |
243.542K |
3.161M |
|
Put Open Interest: |
14.103M |
14.23M |
90.721K |
7.682M |
459.424K |
8.558M |
0 comentarios