
Macro Theme:
Key dates ahead:
- 6/30: JOLTS, Quarterly OPEX
SG Summary:
Update: 6/23: Futures are at fresh lows, with eyes on the MU + PCE catalysts. If those catalysts do not spark buyers, we may see a sharp move lower into the JPM strike area of 7k into 6/30 OPEX. We may elect to buy Friday 7,500 area call flies to hedge against dip buying into these big catalysts.
6/18: Our base case into OPEX is a 1-2% correction (ref 7,475). If traders focus more on higher rates, the major downside support is 7,000 into 6/30 OPEX. To the upside, resistance is at 7,500, with more resistance building into 7,600. We think a sharp rally higher is on hold until more econ data depicts lower inflation/cooler economic data, with the first major econ data on 6/25 (CORE PCE).
Key SG levels for the SPX are:
- Resistance: 7,400, 7,500
- Pivot: 7,380 (bearish <, bullish >) updated 6/25/26
- Support: 7,300, 7,100
Founder’s Note:
Futures are 40bps lower, with no major data on tap this AM.
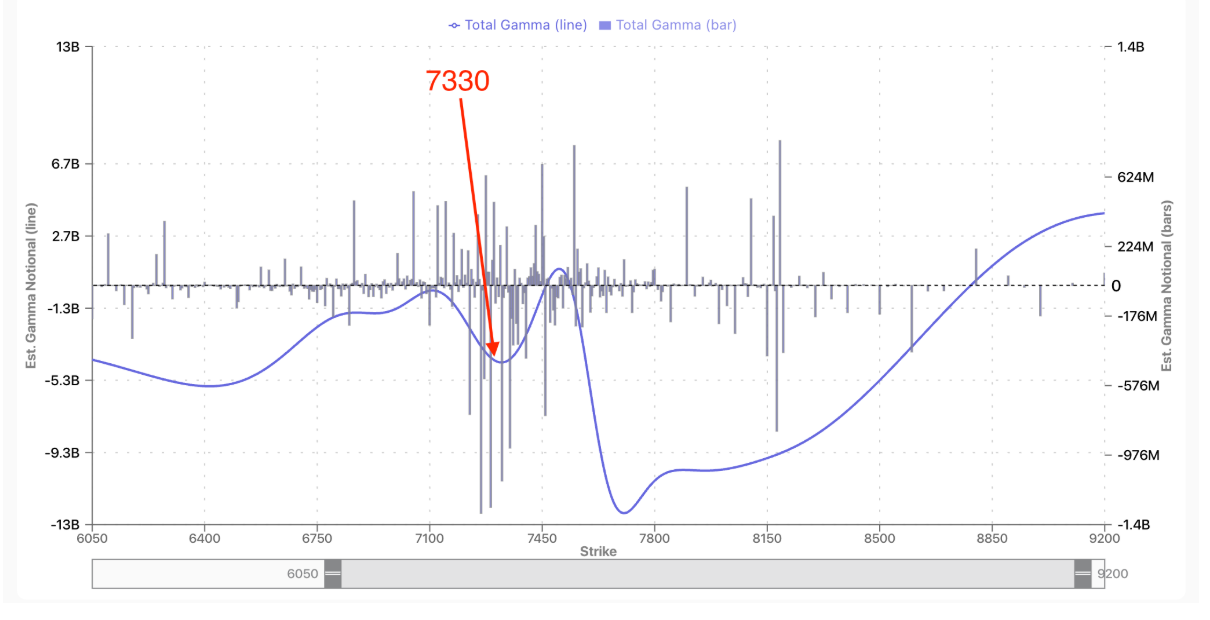
Equities failed to rally after the PCE data yesterday, and the SPX has now lid lower to test 7,300 this AM. Currently is sits in this “bowl” of local negative gamma that is seen on the SPX GEX curve. You can see to either side of current SPX levels is an increase in positive gamma. We read this as the SPX having less selling momentum, and even some support at 7100. This is a far statement from “huge positive gamma support”, and its critical to note that the real driver of volatility here is the tech complex. We take this view of 7,100 support into context with the big 7,000 strike, and 6,900 JPM collar area into 6/30 OPEX. Ultimately should the SPX market dive into this ~7k level we would likely look to be buyers.

We talked yesterday about how strange the volatility complex was with respect to the Qs, both with QQQ IV trading < RV, and QQQ IV relative to SPY. This is the largest spread since 2003 and the internet bubble. That is obviously a function of how fast the AI-related names have been moving, and points to the somewhat dysfunctional state of the current environment. Broad, long standing relationships are just out of sync, and they tend to re-sync with sharp stock moves lower.

Here we see QQQ IV (red) trading below RV (blue), which is something you usually only see coming off a major market low. During a crash, IV spikes as demand for protection surges. Once the panic subsides, IV gets sold, but realized volatility takes time to come back down. That’s why IV can temporarily trade below RV.
What’s unusual here is that the QQQ is only about 5% off its all-time highs. Yet volatility is behaving much more like a market under stress, with IV sitting near the levels seen when the Iran conflict first escalated in March. The difference is that this volatility wasn’t created by a market crash—it came from stocks ripping higher through May and into June, followed by several sharp, violent reversals throughout June.
We keep coming back to this because you can make a compelling case for shorting QQQ volatility. Implied volatility is rich, pricing in roughly 2% daily moves. At the same time, when you compare IV to RV, you can argue that IV is actually cheap because it’s trading below realized volatility. If the recent selling is only the beginning, QQQ IV could have room to move even higher.
Our view is that this elevated IV is becoming a shock absorber for the market. It’s getting rich enough to attract the short-vol crowd, particularly relative to the S&P 500. As more traders step in to sell that premium, it should provide additional liquidity and help dampen the impact of any downside move.

©2025 TenTen Capital LLC DBA SpotGamma
All TenTen Capital LLC DBA SpotGamma materials, information, and presentations are for educational purposes only and should not be considered specific investment advice nor recommendations. Futures, foreign currency and options trading contains substantial risk and is not for every investor. An investor could potentially lose all or more than the initial investment. Risk capital is money that can be lost without jeopardizing one’s financial security or lifestyle. Only risk capital should be used for trading and only those with sufficient risk capital should consider trading. Past performance is not necessarily indicative of future results. VIEW FULL RISK DISCLOSURE https://spotgamma.com/model-faq/disclaimer/
|
|
/ESU26 |
SPX |
SPY |
NDX |
QQQ |
RUT |
IWM |
|---|---|---|---|---|---|---|---|
|
Reference Price: |
$7425.3 |
$7357 |
$733 |
$29440 |
$716 |
$3007 |
$298 |
|
SG Gamma Index™: |
|
-1.53 |
-0.603 |
|
|
|
|
|
SG Implied 1-Day Move: |
|
0.62% |
0.62% |
|
|
|
|
|
SG Implied 5-Day Move: |
|
1.52% |
|
|
|
|
|
|
SG Implied 1-Day Move High: |
|
$7357.89 |
$733.36 |
|
|
|
|
|
SG Implied 1-Day Move Low: |
|
$7267.21 |
$724.32 |
|
|
|
|
|
SG Volatility Trigger™: |
$7468.3 |
$7400 |
$740 |
$29440 |
$720 |
$2950 |
$297 |
|
Absolute Gamma Strike: |
$7068.3 |
$7000 |
$735 |
$30325 |
$700 |
$3000 |
$290 |
|
Call Wall: |
$7868.3 |
$7800 |
$800 |
$30325 |
$800 |
$2965 |
$300 |
|
Put Wall: |
$7368.3 |
$7300 |
$730 |
$28000 |
$700 |
$2850 |
$290 |
|
Zero Gamma Level: |
$7438.3 |
$7370 |
$742 |
$28926 |
$725 |
$3000 |
$303 |
|
Key Support & Resistance Strikes |
|---|
|
SPX Levels: [7000, 8000, 7400, 7500] |
|
SPY Levels: [735, 740, 730, 720] |
|
NDX Levels: [30325, 30000, 28000, 29500] |
|
QQQ Levels: [700, 715, 720, 690] |
|
SPX Combos: [(7703,92.48), (7674,75.15), (7652,86.38), (7622,77.70), (7600,89.62), (7578,86.28), (7563,66.87), (7549,81.37), (7527,85.86), (7497,92.90), (7453,86.31), (7424,71.61), (7402,89.98), (7380,73.13), (7372,91.56), (7357,88.89), (7350,90.36), (7343,92.15), (7335,75.72), (7328,97.21), (7321,74.11), (7313,82.66), (7299,98.89), (7291,94.76), (7284,68.18), (7277,97.19), (7269,76.33), (7262,89.08), (7247,95.67), (7232,78.12), (7225,94.36), (7218,82.25), (7203,98.57), (7174,89.45), (7151,93.41), (7122,90.81), (7100,94.19), (7078,75.98), (7048,76.64), (7026,80.00), (6997,91.04)] |
|
SPY Combos: [727.22, 716.95, 725.02, 729.41] |
|
NDX Combos: [28763, 30324, 29381, 28969] |
|
QQQ Combos: [699.97, 704.94, 737.63, 680.07] |
|
|
SPX |
SPY |
NDX |
QQQ |
RUT |
IWM |
|---|---|---|---|---|---|---|
|
Gamma Tilt: |
0.856 |
0.567 |
1.207 |
0.681 |
0.894 |
0.610 |
|
Gamma Notional (MM): |
‑$380.867M |
‑$1.343B |
$4.307M |
‑$423.796M |
‑$929.092K |
‑$364.179M |
|
25 Delta Risk Reversal: |
-0.054 |
-0.031 |
-0.075 |
-0.055 |
-0.051 |
-0.037 |
|
Call Volume: |
719.766K |
1.628M |
9.008K |
1.097M |
23.089K |
309.866K |
|
Put Volume: |
1.012M |
2.205M |
11.635K |
1.385M |
32.169K |
759.338K |
|
Call Open Interest: |
9.249M |
6.005M |
74.474K |
4.411M |
196.289K |
2.542M |
|
Put Open Interest: |
12.744M |
12.615M |
79.809K |
6.411M |
398.087K |
7.025M |
0 comentarios