
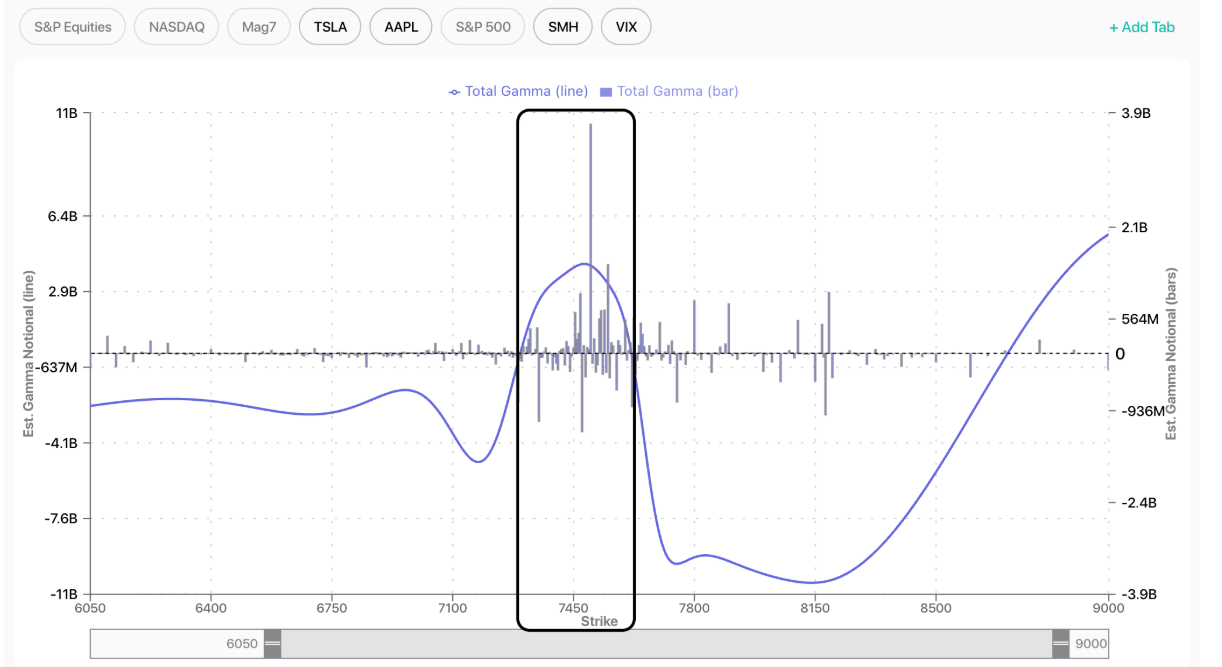
Macro Theme:
Key dates ahead:
- 7/8: FOMC Mins
- 7/14: CPI
- 7/17: OPEX
- 7/22: VIX Exp
SG Summary:
Update 7/7: COR1M is at 2 year lows, and so we are playing for a potential market spasm(s) with cheap short dated put flies (see 7/7 AM note). We think that spasm-downside will continue to be bought before next week. CPI/OPEX, etc next wek offers the potential for major position shifts that change the dip-buying dynamic. Should COR1M remain <8 when positions shift, it could open the door for a larger drawdown. To the upside, we mark 7,600 as major resistance, likely into next week.
Key SG levels for the SPX are:
- Resistance: 7,500, 7,520, 7,550, 7,600
- Pivot: 7,440 (bearish <, bullish >) updated 7/07/26
- Support: 7,450, 7,400, 7,380, 7,300
Founder’s Note:
Futures are 15 bps higher. No major data is on tap for today.
Yesterday was another “buy the dip-day”, as early equity market lows reverted back to opening highs. This is what one would expect from large positive gamma, which continues to dominate both the SPX and top single stocks.

The Iran war appears to be picking up, which is a problem. Oil has thus bar been unresponsive. We are starting to see index skews shift, with the call wing flattening and the put wing steepening. The plot below compares 9/18 skew week-over-week.

This chart is making the rounds on X, likely via GS. It shows “record low put/call skew”, and its very much related to the unusual vol dynamics we’ve discussed in recent days. “Level one” thinking is that traders are now gorging on call options, and selling puts. We think that was true… a month ago. We’ve shown several times how buyside traders are actually selling options in top stocks, which is providing dealers with positive gamma. Further, that positioning makes a lot of sense given the incredibly high call implied vols in those top single stocks into June.

If you look under the hood, what you see is that the leading AI call skews are coming in, while put skews are increasing (ex: DRAM space). The Mag 7’s, which comparatively lagged the big market rally, is seeing the opposite: the calls skews are relatively rich vs the last year, but so are the puts. What do we take from all this? Short puts is a dominant position, and that adds to positive gamma. This is a different from the “hot take” in the chart above, which is that call buyers are jamming skews. Ultimately this feels a bit like market in digestion of highs. The vol market remains out of sorts, with COR1M at our “risk off” alert levels. We add in the Iran situation, which impacts rates, but these dynamics face off against positive gamma support. Given this, we continue to enter cheap “spasm lottos” and will still look for a larger put allocation near OPEX next week.

©2025 TenTen Capital LLC DBA SpotGamma
All TenTen Capital LLC DBA SpotGamma materials, information, and presentations are for educational purposes only and should not be considered specific investment advice nor recommendations. Futures, foreign currency and options trading contains substantial risk and is not for every investor. An investor could potentially lose all or more than the initial investment. Risk capital is money that can be lost without jeopardizing one’s financial security or lifestyle. Only risk capital should be used for trading and only those with sufficient risk capital should consider trading. Past performance is not necessarily indicative of future results. VIEW FULL RISK DISCLOSURE https://spotgamma.com/model-faq/disclaimer/
|
|
/ESU26 |
SPX |
SPY |
NDX |
QQQ |
RUT |
IWM |
|---|---|---|---|---|---|---|---|
|
Reference Price: |
$7530 |
$7482 |
$745 |
$29252 |
$711 |
$2956 |
$293 |
|
SG Gamma Index™: |
|
0.897 |
-0.313 |
|
|
|
|
|
SG Implied 1-Day Move: |
|
0.66% |
0.66% |
|
|
|
|
|
SG Implied 5-Day Move: |
|
1.62% |
|
|
|
|
|
|
SG Implied 1-Day Move High: |
|
$7550.25 |
$752.28 |
|
|
|
|
|
SG Implied 1-Day Move Low: |
|
$7451.25 |
$742.42 |
|
|
|
|
|
SG Volatility Trigger™: |
$7533 |
$7485 |
$748 |
$29075 |
$710 |
$2960 |
$294 |
|
Absolute Gamma Strike: |
$7048 |
$7000 |
$740 |
$30000 |
$710 |
$3000 |
$290 |
|
Call Wall: |
$7648 |
$7600 |
$760 |
$30325 |
$711 |
$2965 |
$300 |
|
Put Wall: |
$7348 |
$7300 |
$740 |
$28000 |
$700 |
$2930 |
$290 |
|
Zero Gamma Level: |
$7487 |
$7439 |
$743 |
$28742 |
$715 |
$3039 |
$302 |
|
Key Support & Resistance Strikes |
|---|
|
SPX Levels: [7000, 7500, 8000, 7600] |
|
SPY Levels: [740, 750, 745, 735] |
|
NDX Levels: [30000, 30325, 28000, 29000] |
|
QQQ Levels: [710, 715, 700, 720] |
|
SPX Combos: [(7849,82.89), (7827,77.75), (7797,96.09), (7775,65.86), (7752,90.60), (7722,77.15), (7700,95.68), (7677,88.14), (7662,66.60), (7647,96.69), (7632,86.48), (7625,82.53), (7617,93.26), (7610,74.35), (7602,98.68), (7587,86.87), (7580,75.29), (7573,95.92), (7558,87.04), (7550,98.28), (7543,93.40), (7535,65.74), (7528,97.41), (7520,84.51), (7513,91.20), (7498,95.49), (7490,71.43), (7475,67.09), (7468,79.47), (7460,76.83), (7453,88.38), (7445,82.07), (7438,89.95), (7430,96.29), (7423,90.04), (7415,74.24), (7408,89.36), (7400,96.05), (7393,85.83), (7378,92.97), (7370,72.47), (7363,76.20), (7348,96.40), (7341,70.61), (7333,71.78), (7326,81.72), (7318,74.87), (7303,97.93), (7288,84.10), (7281,75.03), (7273,78.87), (7251,83.93), (7228,88.35), (7198,95.64), (7176,76.48), (7153,86.82), (7131,71.62), (7124,67.99)] |
|
SPY Combos: [752.19, 757.42, 749.94, 761.91] |
|
NDX Combos: [28785, 28989, 30013, 30335] |
|
QQQ Combos: [700.16, 705.12, 737.05, 695.19] |
|
|
SPX |
SPY |
NDX |
QQQ |
RUT |
IWM |
|---|---|---|---|---|---|---|
|
Gamma Tilt: |
1.082 |
0.792 |
1.268 |
0.772 |
0.445 |
0.404 |
|
Gamma Notional (MM): |
$317.483M |
‑$589.393M |
$6.733M |
‑$331.75M |
‑$73.321M |
‑$1.007B |
|
25 Delta Risk Reversal: |
-0.048 |
-0.032 |
-0.069 |
-0.051 |
-0.047 |
-0.032 |
|
Call Volume: |
636.375K |
1.46M |
9.125K |
941.437K |
19.548K |
225.246K |
|
Put Volume: |
853.751K |
2.152M |
9.478K |
1.16M |
31.26K |
775.028K |
|
Call Open Interest: |
9.608M |
6.232M |
79.353K |
4.494M |
202.743K |
2.534M |
|
Put Open Interest: |
12.989M |
12.259M |
77.282K |
6.152M |
432.581K |
6.951M |
0 comentarios