
Macro Theme:
Key dates ahead:
- 7/17: OPEX
- 7/22: VIX Exp, GOOGL + TSLA ER
SG Summary:
Update 7/13: We have all of the ingredients for a nasty spasm and market correction. But, we need a trigger. It could be Iran, macro data, or ER misses. The savior of this market will be with another round of massive upside in tech earnings. ASML reports 7/15, TSM 7/16, then mags start next week. OPEX should serve to free up positions which have thus far stabilized indexes in the face of extreme correlation lows. For equity market upside with benign Iran/macro data, we look at 7,600-7,625 as a top in to Friday.
Key SG levels for the SPX are:
- Resistance: 7,500, 7,520, 7,600
- Pivot: 7,480 (bearish <, bullish >) updated 7/13/26
- Support: 7,480, 7,400
Founder’s Note:
ES is off 75 bps, NQ -160bps. CL +2% to $80.
OPEX is today, which may loosen up the volatility of the SPX. AI-related stocks have been crumbling dragging down the Nasdaq. That pressure continues today with the release of Kimi-3 which is showing Fable-like capabilities. We remind people that news matters more when vol spreads are whacked out.
This is also such a strange period because we have been rather loudly warning of a market correction, and major components of the equity market are certainly down sharply. At the same tech, Nasdaq is lower, a bit, while SPX has been essentially flat. Essentially its all the stuff that outperformed the last 2 months mean reverting, and the SPX, which was “up the least” is “last to (possibly) drop”.
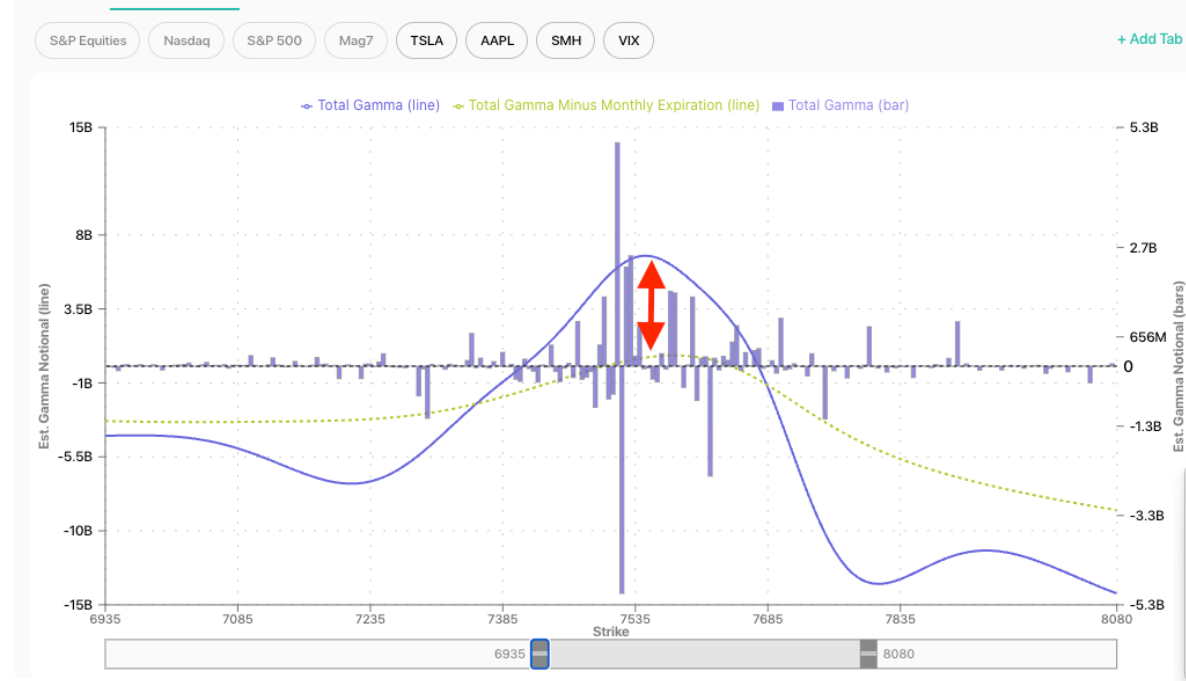
On this topic, we project that SPX positive gamma will be removed with todays OPEX (purple = today GEX, vs Monday in green). Obviously positions will be added/rolled with todays OPEX, but our projection is that the <7,480 Risk Pivot marks a deterministic area of negative gamma.

“Does OPEX matter”? We’d argue that the positive gamma seen in top single stocks (mainly mag7) and SPX has created “buy the dip, sell the rip” price action. Below is a chart of autocorrelation in SPX 30 minute returns. Its attempt to measure if price action in the SPX mean reverts, or trends on an intraday basis. Large negative autocorrelation = mean reverting markets. High autocorrelation = trend.
The thing we notice here is the cyclicality of this feature. You can see there is a wave (sinusoid) which suggests the price action of the SPX shifts from mean reversion -> trending ->mean reversion over time. We marked OPEX with yellow, and you can see that OPEX is often a moment that the trend changes. What you see here at this moment is a deep, mean reverting market into OPEX. The implication here is that we may start to see larger directional moves in the SPX now – moves that don’t mean revert.

How to play? <7,480 we will look to press downside SPX plays. We continue to like rolling cheap <=5 DTE put flies in SPY/QQQ/IWM. Also, we like put ratios in the “tanking tech” like DRAM, EWY, SKHY, MUC, etc.
Here is a rough example of a SKHY 1×2 which seeks to be flattish delta and short vega. The idea is that these stocks all had massive “stock up, vol up” moves, and as they mean revert, that vol is staying stable. If/when these stocks bottom, the vol should come in sharply, which crushes the 2 short puts. Do not use his specific example as we quickly put it together – you want to play with different tenors and strike positioning.

We adjusted the vol skew down here to show how the PNL improves if/when vol declines (purple) vs keeping current skews (yellow).

©2025 TenTen Capital LLC DBA SpotGamma
All TenTen Capital LLC DBA SpotGamma materials, information, and presentations are for educational purposes only and should not be considered specific investment advice nor recommendations. Futures, foreign currency and options trading contains substantial risk and is not for every investor. An investor could potentially lose all or more than the initial investment. Risk capital is money that can be lost without jeopardizing one’s financial security or lifestyle. Only risk capital should be used for trading and only those with sufficient risk capital should consider trading. Past performance is not necessarily indicative of future results. VIEW FULL RISK DISCLOSURE https://spotgamma.com/model-faq/disclaimer/
|
| /ESU26 | SPX | SPY | NDX | QQQ | RUT | IWM |
|---|---|---|---|---|---|---|---|
| Reference Price: | $7576.5 | $7533 | $750 | $29025 | $706 | $2974 | $295 |
| SG Gamma Index™: |
| -0.053 | -0.366 |
|
|
|
|
| SG Implied 1-Day Move: |
| 0.72% | 0.72% |
|
|
|
|
| SG Implied 5-Day Move: |
| 1.62% |
|
|
|
|
|
| SG Implied 1-Day Move High: |
| After open | After open |
|
|
|
|
| SG Implied 1-Day Move Low: |
| After open | After open |
|
|
|
|
| SG Volatility Trigger™: | $7578.5 | $7535 | $750 | $29180 | $711 | $2960 | $295 |
| Absolute Gamma Strike: | $7543.5 | $7500 | $750 | $29000 | $700 | $2965 | $290 |
| Call Wall: | $7643.5 | $7600 | $760 | $29200 | $730 | $2965 | $300 |
| Put Wall: | $7563.5 | $7520 | $750 | $28000 | $700 | $2930 | $290 |
| Zero Gamma Level: | $7533.5 | $7490 | $749 | $28952 | $715 | $3012 | $299 |
| Key Support & Resistance Strikes |
|---|
| SPX Levels: [7500, 7550, 7000, 8000] |
| SPY Levels: [750, 740, 755, 745] |
| NDX Levels: [29000, 28000, 29200, 30000] |
| QQQ Levels: [700, 710, 690, 720] |
| SPX Combos: [(7903,94.18), (7873,67.60), (7850,83.67), (7828,80.26), (7797,97.08), (7775,86.71), (7752,95.41), (7737,68.17), (7730,81.15), (7722,82.68), (7707,66.48), (7700,97.74), (7692,74.78), (7677,92.54), (7669,74.56), (7662,77.85), (7647,97.84), (7639,71.08), (7632,84.97), (7624,93.26), (7617,96.90), (7609,84.17), (7602,99.02), (7594,78.73), (7587,92.95), (7579,96.57), (7571,97.06), (7564,84.80), (7556,88.01), (7549,92.56), (7526,97.64), (7519,99.90), (7511,83.09), (7504,87.44), (7496,87.55), (7489,97.49), (7481,90.04), (7473,98.31), (7466,88.21), (7458,95.96), (7451,85.10), (7443,91.26), (7436,73.56), (7428,96.75), (7421,69.35), (7413,87.04), (7406,80.46), (7398,95.80), (7391,69.35), (7383,86.35), (7376,90.82), (7368,80.33), (7353,95.20), (7338,72.21), (7323,87.22), (7308,67.45), (7300,97.66), (7293,81.93), (7278,86.29), (7247,84.26), (7225,80.39), (7202,94.08), (7172,79.12)] |
| SPY Combos: [757.75, 762.28, 759.26, 754.73] |
| NDX Combos: [28765, 28358, 28561, 28997] |
| QQQ Combos: [729.89, 699.75, 724.87, 709.8] |
|
| SPX | SPY | NDX | QQQ | RUT | IWM |
|---|---|---|---|---|---|---|
| Gamma Tilt: | 0.996 | 0.791 | 0.834 | 0.618 | 0.659 | 0.517 |
| Gamma Notional (MM): | $267.695M | ‑$292.893M | ‑$2.168M | ‑$681.463M | ‑$45.588M | ‑$611.415M |
| 25 Delta Risk Reversal: | -0.052 | -0.035 | -0.072 | -0.055 | -0.05 | -0.032 |
| Call Volume: | 834.65K | 1.953M | 15.402K | 1.153M | 22.614K | 210.199K |
| Put Volume: | 1.094M | 2.437M | 13.424K | 1.637M | 44.867K | 547.278K |
| Call Open Interest: | 10.06M | 6.667M | 83.374K | 4.807M | 223.60K | 2.704M |
| Put Open Interest: | 13.648M | 13.136M | 85.547K | 6.641M | 461.998K | 7.463M |
0 comentarios