
Macro Theme:
Key dates ahead:
- 7/22: VIX Exp, GOOGL + TSLA ER
- 7/26: INTC ER
SG Summary:
Update 7/20: Risk Pivot remains 7,480. SPX positive gamma suggests decent support into key earnings this week.
7/13: We have all of the ingredients for a nasty spasm and market correction. But, we need a trigger. It could be Iran, macro data, or ER misses. The savior of this market will be with another round of massive upside in tech earnings. ASML reports 7/15, TSM 7/16, then mags start next week. OPEX should serve to free up positions which have thus far stabilized indexes in the face of extreme correlation lows. For equity market upside with benign Iran/macro data, we look at 7,600-7,625 as a top in to Friday.
Key SG levels for the SPX are:
- Resistance: 7,500, 7,520, 7,600
- Pivot: 7,480 (bearish <, bullish >) updated 7/13/26
- Support: 7,480, 7,400
Founder’s Note:
Futures are up 60bps after Fridays OPEX.
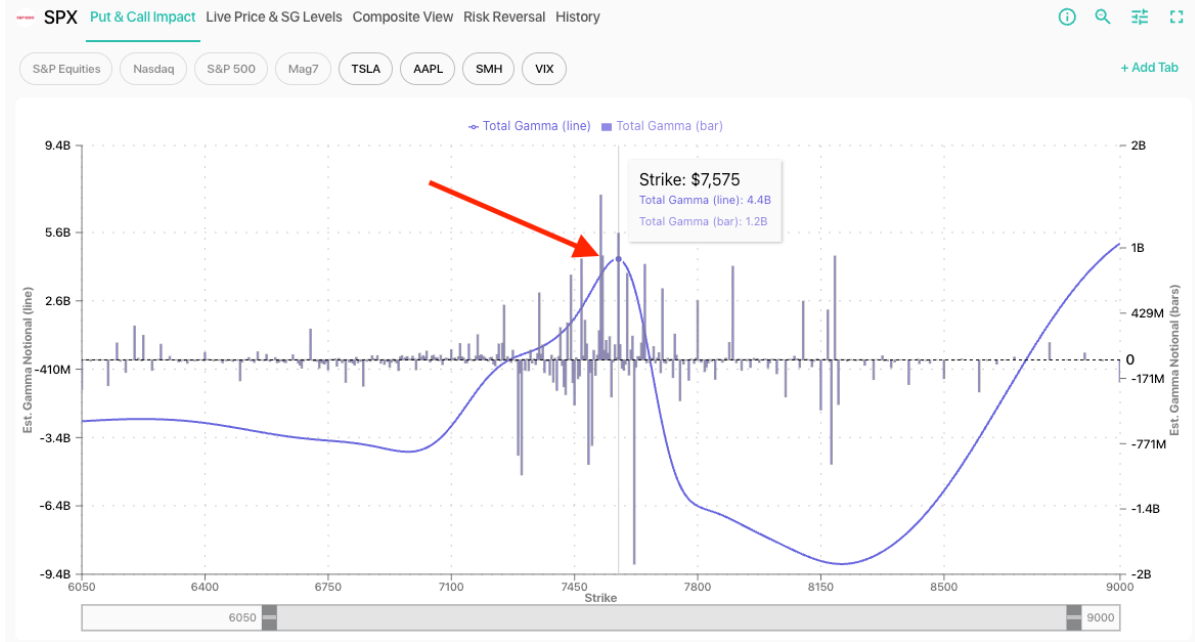
Fresh call selling into OPEX has added positive SPX gamma into the 7,500s. This projects that positive gamma now reigns down into 7,400. This implies that the “buy the dip, sell the rip” behavior that was so prevalent in the S&P500 may persist. Additionally, there were some tech developments over the weekend that inspired the compute-demand story (kimi out of compute). This helps give lift to the memory/semi names that were so beat up the last few weeks. This gives the appearance of SPX being a tough short at this juncture.

Eyes are now going to turn squarely to earnings, which could also re-energize the AI trade (or break it back down). Note that earnings are skewed the ultra-low COR1M readings we’ve been complaining about, too (they raise single stock IVs). GOOGL/TSLA/INTC have the chance to set the mood into August.

The passing of earnings may alleviate the correlation conditions that had us calling for a correction. This has been a bizarre periods for markets. On one hand, the memory/chip sectors have been hit hard the last 2 weeks, which brought the Nasdaq down ~6%. Over that same period, the SPX is flat. That is not much of a highly-correlated risk-off move.

Massive earnings upside would potentially keep the volatility dispersion that we’ve seen too. On that topic the NDX vs SPX drawdown has done little to resync volatilities. A clean example of this is the VXN (Nasdaq VIX) – VIX, which shows a massive spread.
Ultimately, if the SPX is back >7,480 Risk
Pivot,
then we do not want to hold a large core short position.

The volatility risk premium on some of these memory/chip names is also interesting. You can see these sectors are showing +90th IV Rank – this during a period of extreme volatility. You may not want to short vol in these names, but it does feel like trying to short the underlying price and/or buy options is prohibitively expensive. This may offer some relief.

©2025 TenTen Capital LLC DBA SpotGamma
All TenTen Capital LLC DBA SpotGamma materials, information, and presentations are for educational purposes only and should not be considered specific investment advice nor recommendations. Futures, foreign currency and options trading contains substantial risk and is not for every investor. An investor could potentially lose all or more than the initial investment. Risk capital is money that can be lost without jeopardizing one’s financial security or lifestyle. Only risk capital should be used for trading and only those with sufficient risk capital should consider trading. Past performance is not necessarily indicative of future results. VIEW FULL RISK DISCLOSURE https://spotgamma.com/model-faq/disclaimer/
|
|
/ESU26 |
SPX |
SPY |
NDX |
QQQ |
RUT |
IWM |
|---|---|---|---|---|---|---|---|
|
Reference Price: |
$7499.55 |
$7457 |
$743 |
$28592 |
$695 |
$2962 |
$294 |
|
SG Gamma Index™: |
|
-0.592 |
-0.585 |
|
|
|
|
|
SG Implied 1-Day Move: |
|
0.79% |
0.79% |
|
|
|
|
|
SG Implied 5-Day Move: |
|
1.78% |
|
|
|
|
|
|
SG Implied 1-Day Move High: |
|
After open |
After open |
|
|
|
|
|
SG Implied 1-Day Move Low: |
|
After open |
After open |
|
|
|
|
|
SG Volatility Trigger™: |
$7552.55 |
$7510 |
$750 |
$28540 |
$705 |
$2960 |
$295 |
|
Absolute Gamma Strike: |
$7042.55 |
$7000 |
$740 |
$29000 |
$700 |
$3000 |
$290 |
|
Call Wall: |
$7642.55 |
$7600 |
$760 |
$28550 |
$730 |
$2970 |
$300 |
|
Put Wall: |
$7342.55 |
$7300 |
$740 |
$28000 |
$690 |
$2880 |
$290 |
|
Zero Gamma Level: |
$7512.55 |
$7470 |
$747 |
$28735 |
$709 |
$3045 |
$305 |
|
Key Support & Resistance Strikes |
|---|
|
SPX Levels: [7000, 8000, 7500, 7600] |
|
SPY Levels: [740, 750, 745, 755] |
|
NDX Levels: [29000, 28000, 28550, 27000] |
|
QQQ Levels: [700, 690, 680, 660] |
|
SPX Combos: [(7823,79.69), (7801,95.69), (7778,78.18), (7749,92.51), (7734,71.93), (7726,80.27), (7696,96.55), (7674,83.69), (7652,94.05), (7637,67.39), (7622,96.22), (7607,75.89), (7599,97.05), (7592,77.78), (7577,94.54), (7562,80.21), (7555,73.86), (7547,92.93), (7502,90.54), (7488,77.88), (7473,93.46), (7458,90.58), (7450,92.50), (7443,88.57), (7435,70.02), (7428,98.10), (7413,88.23), (7405,77.24), (7398,97.37), (7391,78.78), (7383,88.36), (7376,91.18), (7368,86.40), (7353,94.87), (7338,76.18), (7331,69.64), (7323,93.42), (7301,98.79), (7294,87.02), (7279,81.11), (7271,77.67), (7249,84.81), (7241,71.63), (7227,92.09), (7197,95.95), (7174,83.22), (7152,89.16), (7122,83.68), (7100,87.30), (7092,67.79)] |
|
SPY Combos: [749.26, 757.52, 744.75, 762.02] |
|
NDX Combos: [28364, 27964, 28793, 28593] |
|
QQQ Combos: [699.67, 689.78, 694.72, 705.31] |
|
|
SPX |
SPY |
NDX |
QQQ |
RUT |
IWM |
|---|---|---|---|---|---|---|
|
Gamma Tilt: |
0.943 |
0.606 |
0.925 |
0.596 |
0.445 |
0.441 |
|
Gamma Notional (MM): |
‑$134.409M |
‑$1.347B |
‑$1.713M |
‑$683.162M |
‑$71.002M |
‑$780.649M |
|
25 Delta Risk Reversal: |
-0.06 |
0.00 |
-0.078 |
-0.065 |
-0.057 |
-0.041 |
|
Call Volume: |
738.542K |
1.641M |
17.701K |
1.137M |
29.643K |
219.98K |
|
Put Volume: |
1.117M |
2.467M |
13.521K |
1.595M |
58.604K |
777.463K |
|
Call Open Interest: |
8.905M |
5.954M |
74.561K |
4.351M |
206.517K |
2.401M |
|
Put Open Interest: |
11.952M |
10.922M |
71.246K |
5.951M |
414.548K |
6.247M |
0 comentarios