
Macro Theme:
Key dates ahead:
- 7/30: GDP, PCE, AAPL/AMZN ER
SG Summary:
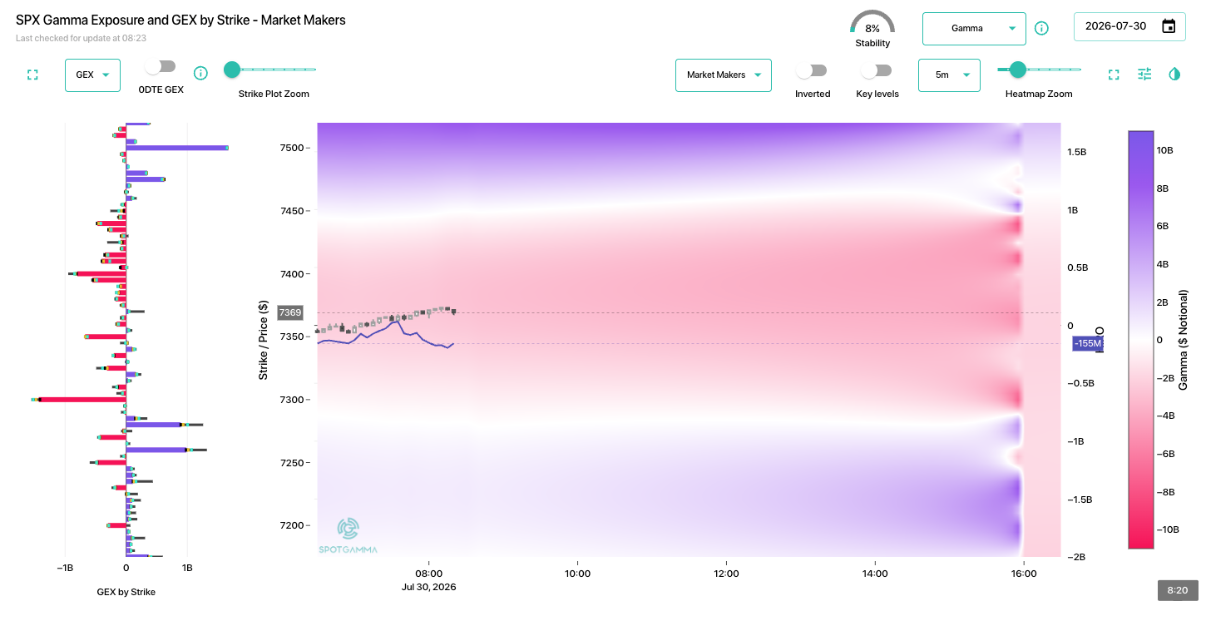
Update 7/29: Into FOMC & Megacap ERs market stability comes with a move >=7,500. To the downside, there is a large pocket of negative gamma down into 7,000. Given this, we outlined a short dated SPX put flies as a trade in our Wed AM note.
Key SG levels for the SPX are:
- Resistance: 7,500, 7,525, 7,550, 7,600
- Pivot: 7,450 (bearish <, bullish >) updated 7/27/26
- Support: 7,400, 7,300
Founder’s Note:
ES futures are up 70bps, NQ +150bps.
CORE PCE at 8:30AM EST, with AAPL & AMZN ER at the close.
MSFT +9% post-ER
META -9% post-ER
Negative gamma reigns over the SPX, which shows resistance >=7450, and support >=7,300 – for today. Looking forward from today we see that 0DTE-based positive gamma support near 7,300 washes away, leaving nothing but negative gamma down into the 7k level.
Yes, the rally feels nice, but do not be lulled to sleep. This is a very unstable setup. If/when positive gamma comes back into the SPX, we will look to re-establish core long positions. Until then, we will play upside with call spreads and/or flies. We also continue to hold put flies per yesterday’s AM note.

Futures did post a nice move up after yesterday’s crashy lows near 7,300. This was driven by a bounce in KOSPI, and decent MSFT earnings (although META put up a stinker).
To help us navigate here, we look for truth in vols. Fixed strike vols in the SPX are a bit lower from last night vs today, which is a mild win for bulls. Certainly the passing of FOMC, and the passing of PCE this AM will remove some event-vol, but we still face the instability of negative gamma for all prices near current SPX levels. Its hard to claim implied vol is a sell here when realized vol is so elevated (yesterday’s closing move was insane).

Ultimately, too, equities have a new problem.
For most of July we complained about the whacked out volatility complex: record high dispersion (DSPX), ultra low correlation (COR1M), and a big gap between NDX & SPX vols. Our view was that these dynamics were unlikely to remain “a new normal” and that things tend to rectify with a volatility spike, which resyncs things.
Below is the DSPX (candles) vs COR1M (blue). As you can see, both started to mean-revert at VIX expiration, 7/22. Dispersion tells us how large single stock vols are relative to other single stocks and the SPX, and correlation informs as if the vol direction of single stocks is in like with SPX. Historically these two indicators move in tandem, but the AI-chase broke those dynamics from March into April. This was because traders violently chased the AI names. Those top AI names are down 30% in a month – and dispersion is coming down. Further, correlation is lifting. This is a signal that the manic AI upside chase is dead, and now we risk seeing all stocks writ-large correct (price lower, vol higher).
Why are all stocks starting to see higher vols? Because the macro picture is deteriorating. We are not saying this from a macro-analyst perspective, we’re simply looking at rates and the Iran situation. Before the idea was the AI could grow our way out of our problems, but that is now coming a bit into question.

As you all likely now now, US long bonds are making lows (yield highs) not seen since 2007. This may not actually matter, but we’d opine that if rate volatility picks up then equity volatility is likely to follow in kind. Given this, we will be closely watching IEF/LQD/HYG/TLT vols & the MOVE index.

©2025 TenTen Capital LLC DBA SpotGamma
All TenTen Capital LLC DBA SpotGamma materials, information, and presentations are for educational purposes only and should not be considered specific investment advice nor recommendations. Futures, foreign currency and options trading contains substantial risk and is not for every investor. An investor could potentially lose all or more than the initial investment. Risk capital is money that can be lost without jeopardizing one’s financial security or lifestyle. Only risk capital should be used for trading and only those with sufficient risk capital should consider trading. Past performance is not necessarily indicative of future results. VIEW FULL RISK DISCLOSURE https://spotgamma.com/model-faq/disclaimer/
|
|
/ESU26 |
SPX |
SPY |
NDX |
QQQ |
RUT |
IWM |
|---|---|---|---|---|---|---|---|
|
Reference Price: |
$7348.68 |
$7316 |
$729 |
$27192 |
$661 |
$2906 |
$288 |
|
SG Gamma Index™: |
|
-2.502 |
-0.893 |
|
|
|
|
|
SG Implied 1-Day Move: |
|
0.64% |
0.64% |
|
|
|
|
|
SG Implied 5-Day Move: |
|
1.62% |
|
|
|
|
|
|
SG Implied 1-Day Move High: |
|
After open |
After open |
|
|
|
|
|
SG Implied 1-Day Move Low: |
|
After open |
After open |
|
|
|
|
|
SG Volatility Trigger™: |
$7507.68 |
$7475 |
$743 |
$28060 |
$680 |
$2960 |
$295 |
|
Absolute Gamma Strike: |
$7032.68 |
$7000 |
$730 |
$28000 |
$660 |
$2880 |
$290 |
|
Call Wall: |
$7732.68 |
$7700 |
$800 |
$28550 |
$730 |
$2970 |
$300 |
|
Put Wall: |
$7332.68 |
$7300 |
$730 |
$28000 |
$660 |
$2880 |
$285 |
|
Zero Gamma Level: |
$7416.68 |
$7384 |
$744 |
$27742 |
$690 |
$3010 |
$301 |
|
Key Support & Resistance Strikes |
|---|
|
SPX Levels: [7000, 7500, 8000, 7400] |
|
SPY Levels: [730, 740, 720, 750] |
|
NDX Levels: [28000, 27000, 27200, 28550] |
|
QQQ Levels: [660, 680, 700, 650] |
|
SPX Combos: [(7675,72.87), (7653,89.83), (7623,81.52), (7601,90.15), (7572,84.23), (7550,80.13), (7543,72.83), (7528,68.70), (7499,82.87), (7448,83.22), (7419,78.65), (7397,92.56), (7375,78.24), (7367,89.87), (7353,97.12), (7338,81.62), (7331,70.04), (7323,97.14), (7309,76.24), (7302,99.49), (7294,76.19), (7287,86.93), (7280,93.76), (7272,98.09), (7258,93.15), (7250,97.22), (7243,85.00), (7236,68.33), (7228,94.47), (7221,93.18), (7206,69.77), (7199,98.38), (7192,80.46), (7177,91.71), (7170,85.84), (7163,89.28), (7148,96.25), (7141,66.92), (7133,85.68), (7126,74.51), (7119,87.05), (7097,94.85), (7089,73.28), (7075,70.84), (7053,83.37), (7024,83.35), (7002,94.11), (6972,72.85)] |
|
SPY Combos: [728.17, 737.8, 717.8, 768.17] |
|
NDX Combos: [27138, 26703, 27002, 26512] |
|
QQQ Combos: [659.96, 680.23, 657.26, 694.41] |
|
|
SPX |
SPY |
NDX |
QQQ |
RUT |
IWM |
|---|---|---|---|---|---|---|
|
Gamma Tilt: |
0.785 |
0.450 |
0.700 |
0.550 |
0.357 |
0.311 |
|
Gamma Notional (MM): |
‑$824.054M |
‑$2.553B |
‑$10.37M |
‑$976.567M |
‑$113.187M |
‑$1.687B |
|
25 Delta Risk Reversal: |
-0.065 |
-0.047 |
-0.071 |
-0.053 |
-0.062 |
-0.047 |
|
Call Volume: |
758.235K |
1.952M |
10.829K |
1.482M |
17.323K |
318.099K |
|
Put Volume: |
1.046M |
2.858M |
16.466K |
1.533M |
40.472K |
1.497M |
|
Call Open Interest: |
9.573M |
6.298M |
87.03K |
5.303M |
229.733K |
2.694M |
|
Put Open Interest: |
12.886M |
12.122M |
90.948K |
6.452M |
462.818K |
7.251M |
0 comentarios