
Macro Theme:
Key dates ahead:
- 9/2: AVGO ER
- 9/3: Jobs/ISM PMI
- 9/4: NFP
- 9/7: Labor Day holiday
- 9/11: CPI
- 9/18: OPEX
SG Summary:
Update 8/31: JHole has left us with higher probabilities of a Sep hike. Traders pushed the SPX back to 7,700, but also sold options after Warsh’s speech. Through IV’s we also now see a greater focus upcoming macro data like NFP, ISM, CPI, etc.
Given this, we have to back away from the view of an equity market set to trend higher into Sep OPEX, and instead look to more tactical mean reversion trading (vs positioning for upside trend). The Risk Pivot remains at 7,650.
Key SG levels for the SPX are:
- Resistance: 7,700, 7,720, 7,750, 7,800
- Pivot: 7,650 (bearish <, bullish >) updated 8/20/26
- Support: 7,600, 7,550
Founder’s Note:
Futures are flat, and up off of overnight lows of -30bps (an implied test of SPX 7,600).
DELL earnings crushed it: +9% to $460
AVGO on deck tonight. See our earnings writeup here.
ISM 10AM EST.
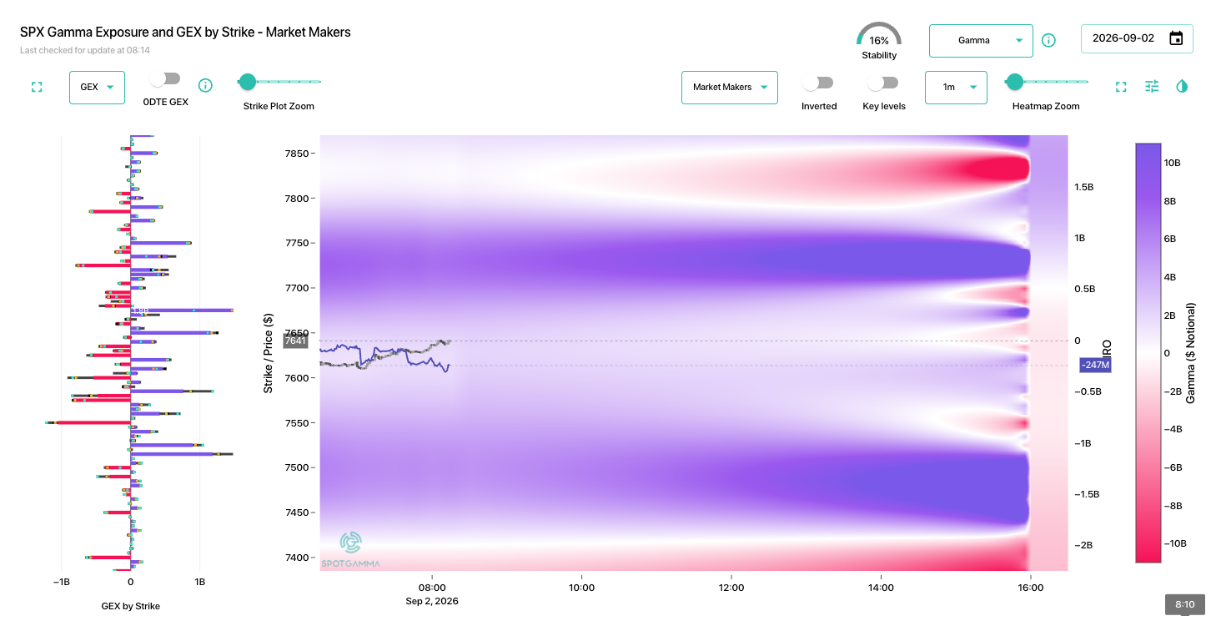
The SPX is still cloaked in positive gamma. Given this, we anticipate dips bought and rallies sold, which appears to be in the context of a relative downward trend. We default to “downward trend” as long as the SPX is below the Risk Pivot (7,650). Ultimately we don’t see downside action getting truly spicy until/unless 7,550 is broken.

We often look to the vol space for signs of panic. The headline: no one cares.
SPX fixed strike vol from Thursday night (pre-JHole) to this AM shows some consternation around mid-Sep (FOMC, OPEX), but >=Oct vols are actually lower.

The goal here is to decide when people start caring, and that would show likely in certain price levels being breached, which would correspond with shifts higher in vols. I’m guessing we’d start to see that evidence sub 7,600, and much more likely <7,550.
Below is Compass for top single stocks, and you can see that they are all in the lower right quadrant: that is traders leaning into bullish plays. This position could, of course, be wrong, but the message here is “no panic”. That being said, we can see both SPY and the most-rate-sensitive IWM pushing lower right, towards a put skew. Because the IV Rank is still <10 (Y axis) this is so far more about a loss of upside excitement vs hedging for downside.

©2025 TenTen Capital LLC DBA SpotGamma
All TenTen Capital LLC DBA SpotGamma materials, information, and presentations are for educational purposes only and should not be considered specific investment advice nor recommendations. Futures, foreign currency and options trading contains substantial risk and is not for every investor. An investor could potentially lose all or more than the initial investment. Risk capital is money that can be lost without jeopardizing one’s financial security or lifestyle. Only risk capital should be used for trading and only those with sufficient risk capital should consider trading. Past performance is not necessarily indicative of future results. VIEW FULL RISK DISCLOSURE https://spotgamma.com/model-faq/disclaimer/
|
|
/ESU26 |
SPX |
SPY |
NDX |
QQQ |
RUT |
IWM |
|---|---|---|---|---|---|---|---|
|
Reference Price: |
$7696.2 |
$7686 |
$766 |
$29456 |
$716 |
$2956 |
$293 |
|
SG Gamma Index™: |
|
1.088 |
-0.288 |
|
|
|
|
|
SG Implied 1-Day Move: |
|
0.59% |
0.59% |
|
|
|
|
|
SG Implied 5-Day Move: |
|
1.39% |
|
|
|
|
|
|
SG Implied 1-Day Move High: |
|
In PM note |
In PM note |
|
|
|
|
|
SG Implied 1-Day Move Low: |
|
In PM note |
In PM note |
|
|
|
|
|
SG Volatility Trigger™: |
$7710.2 |
$7700 |
$766 |
$29270 |
$715 |
$3000 |
$297 |
|
Absolute Gamma Strike: |
$8010.2 |
$8000 |
$765 |
$29500 |
$700 |
$3000 |
$290 |
|
Call Wall: |
$7810.2 |
$7800 |
$780 |
$29275 |
$730 |
$3005 |
$310 |
|
Put Wall: |
$7510.2 |
$7500 |
$765 |
$29600 |
$700 |
$2960 |
$290 |
|
Zero Gamma Level: |
$7651.2 |
$7641 |
$765 |
$29161 |
$715 |
$3039 |
$302 |
|
Key Support & Resistance Strikes |
|---|
|
SPX Levels: [8000, 7000, 7700, 7600] |
|
SPY Levels: [765, 770, 760, 766] |
|
NDX Levels: [29500, 29275, 30000, 29000] |
|
QQQ Levels: [700, 720, 715, 710] |
|
SPX Combos: [(8063,65.74), (8047,94.34), (8040,88.17), (8024,65.54), (8017,80.65), (8001,97.94), (7978,82.76), (7947,93.73), (7924,78.90), (7917,79.56), (7901,98.83), (7894,77.05), (7878,89.87), (7871,81.16), (7848,97.25), (7832,70.87), (7824,89.23), (7817,90.20), (7809,80.69), (7801,99.43), (7794,89.60), (7786,79.36), (7778,90.42), (7763,88.09), (7755,74.67), (7748,97.79), (7740,86.21), (7732,88.49), (7725,90.71), (7717,89.76), (7709,70.84), (7702,69.57), (7694,74.15), (7671,66.43), (7663,97.70), (7655,85.13), (7648,96.59), (7640,85.81), (7632,88.16), (7625,90.49), (7617,95.29), (7609,77.75), (7602,95.71), (7594,73.85), (7586,83.49), (7579,91.07), (7563,85.34), (7548,96.79), (7532,71.77), (7525,81.11), (7517,93.80), (7502,98.64), (7486,68.40), (7479,79.97), (7448,88.83), (7425,70.31), (7417,76.10), (7402,93.15), (7379,71.22), (7348,82.10)] |
|
SPY Combos: [777.81, 787.81, 797.82, 748.58] |
|
NDX Combos: [29987, 29280, 28750, 29457] |
|
QQQ Combos: [712.87, 699.97, 730.06, 721.47] |
|
|
SPX |
SPY |
NDX |
QQQ |
RUT |
IWM |
|---|---|---|---|---|---|---|
|
Gamma Tilt: |
1.077 |
0.788 |
1.303 |
0.857 |
0.371 |
0.402 |
|
Gamma Notional (MM): |
$295.481M |
‑$497.954M |
$11.582M |
‑$117.205M |
‑$156.217M |
‑$1.393B |
|
25 Delta Risk Reversal: |
-0.038 |
-0.035 |
-0.045 |
-0.034 |
-0.04 |
-0.041 |
|
Call Volume: |
635.772K |
1.183M |
6.83K |
737.119K |
31.243K |
238.168K |
|
Put Volume: |
801.509K |
1.623M |
11.604K |
991.065K |
43.021K |
611.797K |
|
Call Open Interest: |
9.572M |
5.571M |
85.291K |
5.068M |
248.03K |
2.95M |
|
Put Open Interest: |
13.47M |
13.522M |
101.348K |
6.705M |
519.70K |
7.363M |
0 comentarios