
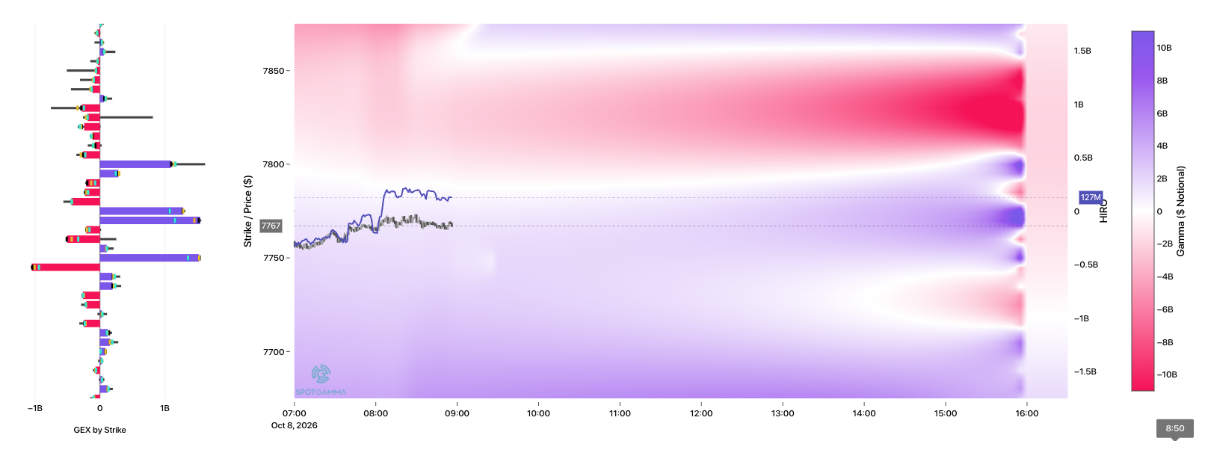
Macro Theme:
Key dates ahead:
- 10/13: Bank earnings
- 10/14: CPI
- 11/3: Elections
SG Summary:
Update 10/6: Despite higher yields, stocks are sliding higher. If those yields come down, then we may see strong moves higher in stocks. Given this, we think its critical to maintain upside exposure, and for that we prefer NVDA Nov of Dec calls as the IV rank for NVDA is <5.
Key SG levels for the SPX are:
- Resistance: 7,800, 7,830, 7,850, 7,900
- Pivot: 7,690 (bearish <, bullish >) updated 9/22/26
- Support: 7,750, 7,700
Founder’s Note:
Futures are off 40bps, with the 10Y making fresh highs to 5.32%. Oil is up 3%.
Positive SPX gamma still persists below, which suggests that dips should continue to be bought – much like we saw yesterday.

As the market skids along, 5-day realized vol is now a 6% with 1-month <=10%. We also see no warning signs in the VIX term structure, which remains low & in contango.

One of the interesting developments in with TLT IV & Skew. 10-days ago there was extreme IV and a mild put skew in TLT. 5-days ago that put skew turned to a call skew, as traders were seemingly positioning for yields to come down (and TLT to rally). That call skew is fading now, to something more neutral. This may be a signal that the bond bulls are throwing in the towel. We are still in the camp that we don’t really need yields to come down – we just need the rate of change to stop being so sharply higher.
On this note, we still see a heavy call skew in IWM/QQQ/SPY, suggesting traders are betting (or hedging against) upside equity moves.

So…what’s an equity trader to do?
Our strongest conviction is that short dated index implied vol is too low to warrant selling. Does this mean you want to get long? Maybe not – but the risk/reward with IV ranks <=10 in IWM/SPY/QQQ show little reward for shorting.
Single stock vols are more interesting – only for names that do not have earnings coming up (and many stocks have earnings within 30-days).
Single stock IVs are on average higher now because of earnings, and there is a strong call skew in these single stocks. Below is the average call skew for NDX stocks, and you can see its near multi-year lows. This reflects one-sided bullish positioning. Normally we’d think “let’s play the contrarian” however being short this market has been a fools errand since April.
The unfortunate summary of all this is that shorting index vol doesn’t make sense. Shorting single stock vol outside of earnings plays doesn’t make sense. As long as the SPX remains above the Risk Pivot we want to maintain equity long exposure, as that has been working. We continue to like holding NVDA and/or SMH Nov or Dec calls as an upside proxy, too. Outside of that, we like betting on intraday mean reversion (buying dips, selling rips).

©2025 TenTen Capital LLC DBA SpotGamma
All TenTen Capital LLC DBA SpotGamma materials, information, and presentations are for educational purposes only and should not be considered specific investment advice nor recommendations. Futures, foreign currency and options trading contains substantial risk and is not for every investor. An investor could potentially lose all or more than the initial investment. Risk capital is money that can be lost without jeopardizing one’s financial security or lifestyle. Only risk capital should be used for trading and only those with sufficient risk capital should consider trading. Past performance is not necessarily indicative of future results. VIEW FULL RISK DISCLOSURE https://spotgamma.com/model-faq/disclaimer/
|
|
/ESZ26 |
SPX |
SPY |
NDX |
QQQ |
RUT |
IWM |
|---|---|---|---|---|---|---|---|
|
Reference Price: |
$7853.45 |
$7801 |
$777 |
$31160 |
$757 |
$2793 |
$277 |
|
SG Gamma Index™: |
|
4.548 |
0.097 |
|
|
|
|
|
SG Implied 1-Day Move: |
|
0.53% |
0.53% |
|
|
|
|
|
SG Implied 5-Day Move: |
|
1.55% |
|
|
|
|
|
|
SG Implied 1-Day Move High: |
|
$7817.36 |
$779.08 |
|
|
|
|
|
SG Implied 1-Day Move Low: |
|
$7734.94 |
$770.86 |
|
|
|
|
|
SG Volatility Trigger™: |
$7822.45 |
$7770 |
$777 |
$30990 |
$757 |
$2850 |
$282 |
|
Absolute Gamma Strike: |
$8052.45 |
$8000 |
$770 |
$31000 |
$760 |
$2800 |
$280 |
|
Call Wall: |
$7952.45 |
$7900 |
$785 |
$31500 |
$760 |
$2855 |
$300 |
|
Put Wall: |
$7552.45 |
$7500 |
$767 |
$28000 |
$700 |
$2770 |
$275 |
|
Zero Gamma Level: |
$7750.45 |
$7698 |
$775 |
$30616 |
$750 |
$2871 |
$290 |
|
Key Support & Resistance Strikes |
|---|
|
SPX Levels: [8000, 7800, 7000, 7700] |
|
SPY Levels: [770, 775, 785, 780] |
|
NDX Levels: [31000, 31500, 30000, 32000] |
|
QQQ Levels: [760, 750, 740, 755] |
|
SPX Combos: [(8176,92.64), (8168,82.56), (8161,91.00), (8153,97.75), (8137,80.45), (8129,89.78), (8122,90.83), (8114,74.61), (8098,99.44), (8090,79.15), (8083,77.29), (8075,71.71), (8067,85.60), (8059,76.77), (8051,99.37), (8044,91.89), (8028,94.81), (8020,69.99), (8012,77.56), (7997,99.56), (7989,73.87), (7981,83.79), (7973,90.17), (7958,82.76), (7950,97.99), (7942,77.21), (7927,98.60), (7919,89.49), (7911,81.66), (7903,99.87), (7895,63.86), (7888,95.54), (7880,98.44), (7872,99.71), (7864,84.57), (7856,96.91), (7849,99.83), (7841,96.98), (7833,99.53), (7825,99.34), (7817,98.69), (7810,95.82), (7802,99.62), (7794,74.43), (7786,84.93), (7771,81.24), (7763,90.12), (7747,94.03), (7739,75.43), (7732,87.59), (7724,94.28), (7716,72.15), (7708,79.66), (7700,97.01), (7693,74.11), (7677,91.69), (7661,80.72), (7654,97.15), (7638,86.02), (7630,68.14), (7622,84.90), (7607,72.20), (7599,96.48), (7591,74.52), (7576,82.50), (7568,66.74), (7552,89.39), (7529,87.82), (7498,97.22), (7482,74.35), (7474,71.63), (7451,88.17), (7427,84.12)] |
|
SPY Combos: [786.93, 782.26, 779.92, 784.59] |
|
NDX Combos: [31254, 31472, 31659, 31503] |
|
QQQ Combos: [760.37, 761.89, 770.24, 764.93] |
|
|
SPX |
SPY |
NDX |
QQQ |
RUT |
IWM |
|---|---|---|---|---|---|---|
|
Gamma Tilt: |
1.356 |
1.063 |
1.591 |
1.054 |
0.372 |
0.328 |
|
Gamma Notional (MM): |
$1.227B |
$570.773M |
$14.193M |
$245.869M |
‑$134.113M |
‑$2.009B |
|
25 Delta Risk Reversal: |
-0.032 |
-0.015 |
-0.044 |
-0.025 |
-0.032 |
-0.014 |
|
Call Volume: |
747.603K |
1.453M |
8.008K |
913.881K |
21.795K |
440.79K |
|
Put Volume: |
1.012M |
2.093M |
11.642K |
1.451M |
55.064K |
938.158K |
|
Call Open Interest: |
9.565M |
6.139M |
80.104K |
5.194M |
299.558K |
3.305M |
|
Put Open Interest: |
13.637M |
13.319M |
124.879K |
7.679M |
510.053K |
7.698M |
0 comentarios