
Macro Theme:
Key dates ahead:
- 10/16: OPEX
- 10/21: VIX exp, META/TSLA ER
- 11/3: Elections
SG Summary:
Update 10/15: A break of the 7,690 Risk Pivot suggests a test of 7,600. If implied vols continue to risk in a downside move to 7,600, then we’d look for a wash-out move to 7,450. If there is a sharp downside move into Friday 10/16, we’d look for a relief rally into early next week due to tomorrows OPEX.
10/12: Vol into CPI on Wednesday 10/14 is very low, and so we want to avoid being short of options into the print as well as OPEX. After Monday, an SPX move >7,825 has the potential to move up quickly due to negative gamma. Support is solid down in to 7,700. <7,700 we shift to a risk-off stance.
10/6: Despite higher yields, stocks are sliding higher. If those yields come down, then we may see strong moves higher in stocks. Given this, we think its critical to maintain upside exposure, and for that we prefer NVDA Nov of Dec calls as the IV rank for NVDA is <5.
Key SG levels for the SPX are:
- Resistance: 7,7750, 7,800
- Pivot: 7,690 (bearish <, bullish >) updated 9/22/26
- Support: 7,750, 7,700, 7,650, 7,600, 7,450
Founder’s Note:
Futures are up +15bps ahead of today’s OPEX.
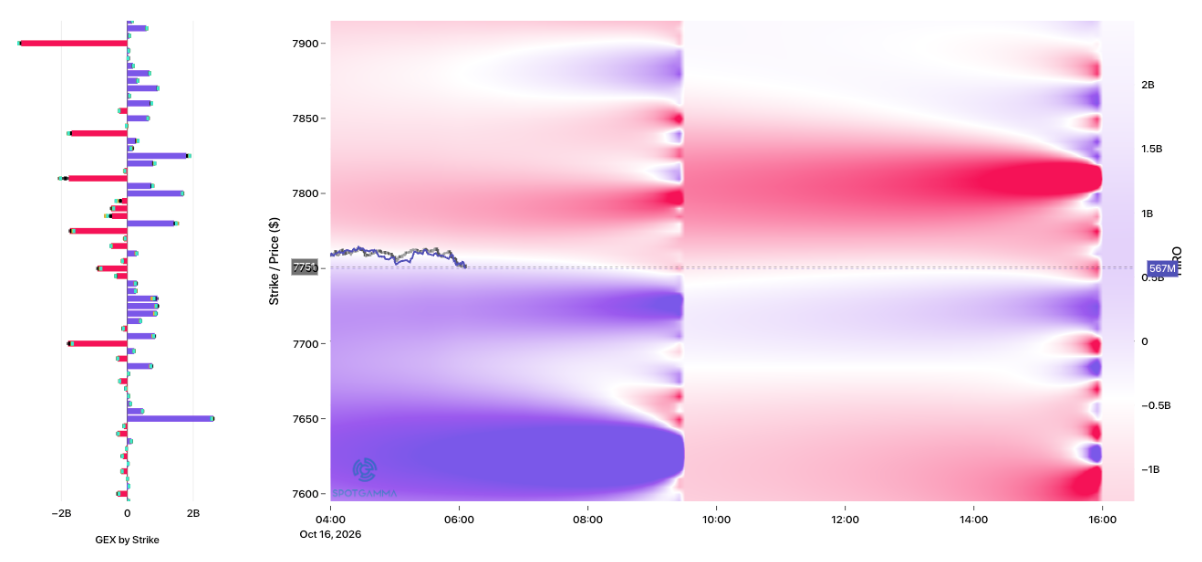
Support is at 7,700 today, with resistance up at 7,775 then 7,800. This AM’s SPX expiration will clear out the bulk of SPX positive gamma (blue), however we’d expect that to be rebuilt after the 9:30 AM expiration, and as 0DTE traders step in. That said, the gamma map after 9:30 AM and going forward is primarily negative gamma, suggesting the SPX is setting up for further strong moves. We continue to want to be long of stocks while the SPX is > 7,690 Risk Pivot.

Vols continue to come in from Wednesday’s equity decline, which is a good sign for bulls.

Looking more specifically at tech, the NDX 12/31 skew is plotted today (teal) vs that same skew from Wednesday night (gray). The ~25 delta put area has come in a bit, as designated by the red bars beneath. More critically, the skew rests very close to the lows of its 90-day range (teal band). This suggests that traders are just not that worried about further selling. Should the SPX lose the Risk Pivot, and the equity selling broaden out – or if credit sparks, then we think that vols would lift materially and that put skew would steepen.

We continue to watch the idea of equity rotation vs a highly-correlated rotation out of stocks and into cash/bonds/etc. The former is arguably constructive for stocks while the later would be destructive.
Hammer ing this point home, you can see the highly correlated selloff into March-end as the Iran war started with RSP (equal weight SPX) vs SMH. Since October 6th the SMH is off nearly -15% while RSP is ~10%.

OPEX can often times be a turning point for stocks, and so we are on watch for a tech bottom as bearish tech positions are removed with OPEX. You can see below that this is a relatively small expiration for the S&P (top left), but a fairly sizable expiration for single stocks (top right).
This clearing of positions does play directly into earnings season, with META/TSLA/TXN kicking it off on 10/21 and the other mags reporting >=10/28.

©2025 TenTen Capital LLC DBA SpotGamma
All TenTen Capital LLC DBA SpotGamma materials, information, and presentations are for educational purposes only and should not be considered specific investment advice nor recommendations. Futures, foreign currency and options trading contains substantial risk and is not for every investor. An investor could potentially lose all or more than the initial investment. Risk capital is money that can be lost without jeopardizing one’s financial security or lifestyle. Only risk capital should be used for trading and only those with sufficient risk capital should consider trading. Past performance is not necessarily indicative of future results. VIEW FULL RISK DISCLOSURE https://spotgamma.com/model-faq/disclaimer/
|
|
/ESZ26 |
SPX |
SPY |
NDX |
QQQ |
RUT |
IWM |
|---|---|---|---|---|---|---|---|
|
Reference Price: |
$7792.45 |
$7744 |
$771 |
$29935 |
$728 |
$2767 |
$275 |
|
SG Gamma Index™: |
|
1.065 |
-0.378 |
|
|
|
|
|
SG Implied 1-Day Move: |
|
0.52% |
0.52% |
|
|
|
|
|
SG Implied 5-Day Move: |
|
1.22% |
|
|
|
|
|
|
SG Implied 1-Day Move High: |
|
After open |
After open |
|
|
|
|
|
SG Implied 1-Day Move Low: |
|
After open |
After open |
|
|
|
|
|
SG Volatility Trigger™: |
$7808.45 |
$7760 |
$774 |
$29950 |
$730 |
$2840 |
$280 |
|
Absolute Gamma Strike: |
$8048.45 |
$8000 |
$775 |
$30000 |
$730 |
$2750 |
$275 |
|
Call Wall: |
$7948.45 |
$7900 |
$780 |
$30100 |
$740 |
$2950 |
$300 |
|
Put Wall: |
$7748.45 |
$7700 |
$772 |
$29500 |
$700 |
$2750 |
$275 |
|
Zero Gamma Level: |
$7747.45 |
$7699 |
$770 |
$30085 |
$732 |
$2823 |
$283 |
|
Key Support & Resistance Strikes |
|---|
|
SPX Levels: [8000, 7750, 7700, 7800] |
|
SPY Levels: [775, 770, 772, 760] |
|
NDX Levels: [30000, 29500, 30300, 31000] |
|
QQQ Levels: [730, 720, 740, 725] |
|
SPX Combos: [(8124,90.13), (8108,75.40), (8100,99.24), (8093,75.93), (8077,86.25), (8069,84.50), (8062,76.34), (8054,98.95), (8038,91.84), (8031,87.45), (8023,85.18), (8007,75.37), (8000,99.15), (7992,66.30), (7976,88.56), (7953,94.53), (7938,80.45), (7930,80.21), (7922,94.78), (7907,85.61), (7899,99.42), (7891,81.47), (7883,89.56), (7876,95.69), (7868,93.36), (7860,83.30), (7852,97.85), (7845,76.31), (7837,97.60), (7829,93.28), (7822,99.47), (7814,99.29), (7806,88.96), (7798,99.20), (7791,95.34), (7783,94.92), (7775,85.56), (7767,70.76), (7752,92.86), (7744,89.99), (7736,85.82), (7729,93.92), (7721,84.17), (7713,96.99), (7705,87.45), (7698,99.70), (7690,83.58), (7682,95.47), (7674,94.95), (7667,96.52), (7659,85.75), (7651,99.51), (7643,92.27), (7636,80.42), (7628,97.53), (7620,73.96), (7612,87.45), (7597,98.93), (7589,65.61), (7581,79.96), (7574,88.91), (7558,71.67), (7550,91.88), (7543,71.14), (7527,92.14), (7496,98.72), (7489,65.21), (7473,90.82), (7450,91.98), (7427,85.82), (7403,95.11), (7372,82.20)] |
|
SPY Combos: [764.98, 768.06, 758.06, 762.67] |
|
NDX Combos: [29397, 28768, 29606, 29187] |
|
QQQ Combos: [725.2, 699.69, 717.18, 720.09] |
|
|
SPX |
SPY |
NDX |
QQQ |
RUT |
IWM |
|---|---|---|---|---|---|---|
|
Gamma Tilt: |
1.065 |
0.785 |
0.902 |
0.694 |
0.462 |
0.405 |
|
Gamma Notional (MM): |
$182.629M |
‑$894.886M |
‑$5.165M |
‑$903.187M |
‑$125.361M |
‑$1.878B |
|
25 Delta Risk Reversal: |
-0.043 |
-0.024 |
-0.057 |
-0.04 |
-0.033 |
-0.017 |
|
Call Volume: |
851.748K |
1.883M |
18.566K |
1.77M |
28.507K |
464.367K |
|
Put Volume: |
1.365M |
2.709M |
16.048K |
2.353M |
58.938K |
858.791K |
|
Call Open Interest: |
10.017M |
6.216M |
84.732K |
5.832M |
346.939K |
3.707M |
|
Put Open Interest: |
14.864M |
13.90M |
128.745K |
8.334M |
544.607K |
7.766M |
0 comentarios