
Macro Theme:
Key dates ahead:
- 10/21: VIX exp, META/TSLA ER
- 11/3: Elections
SG Summary:
Update 10/15: A break of the 7,690 Risk Pivot suggests a test of 7,600. If implied vols continue to risk in a downside move to 7,600, then we’d look for a wash-out move to 7,450. If there is a sharp downside move into Friday 10/16, we’d look for a relief rally into early next week due to tomorrows OPEX.
10/6: Despite higher yields, stocks are sliding higher. If those yields come down, then we may see strong moves higher in stocks. Given this, we think its critical to maintain upside exposure, and for that we prefer NVDA Nov of Dec calls as the IV rank for NVDA is <5.
Key SG levels for the SPX are:
- Resistance: 7,700, 7,750, 7,800
- Pivot: 7,690 (bearish <, bullish >) updated 9/22/26
- Support: 7,600, 7,450
Founder’s Note:
ES futures are up 50bps, NQ +130bps. US 10 year flat at 5.1, with WTI off 1% to $99.
The big weekend discussion in the options space was about the major move in VIX on Friday, which was surprising given the relatively calm 1% decline in the index itself. The TLDR on this is that there was over 100k of very short dated Oct 21 VIX positioned near the 20 strike into that VIX move, and over 1mm VIX calls for Oct 21 exp traded on the day. That speaks to a ton of VIX “gamma” which likely created that springy VIX move. We break it down in a video here.
The key thing is that VXN had a much smaller relative move – suggesting that what happened to the VIX was not a symptom of the larger vol complex. This matters because if the vol complex starts to jump, then its a major signal that equities are on the cusp of a large, broad selloff. The biggest position net changes in VIX were for short dated puts, too.
Clearly if you are in tech you are already in the throes of big selling: QQQ -6.5% since 10/6, but SPY only off 2% during that same period.
What bears need here is equity correlation. We posit that unless the S&P, DIA, RSP, etc start to sell with the same conviction as tech, then the selling is unlikely to continue. Thus far equity correlation has been muted, with COR1M near 10. There are rumors around today of an Iran de-esclation plan (good luck), and we obviously have huge earnings this week with SPCX tomorrow and META/TSLA Wed. This data coming in plays directly to FOMC and elections at the end of the month. This signifies plenty of incoming data to back narratives.
Our bottom line: If the SPX can regain the Risk Pivot at 7,690, then traders have to start watching for a snappy right tail move. For playing upside and a quick recovery bounce (and if/when SPX >7,700), we will look to play short dated 1-2 DTE SPX >=7,800 call flies.
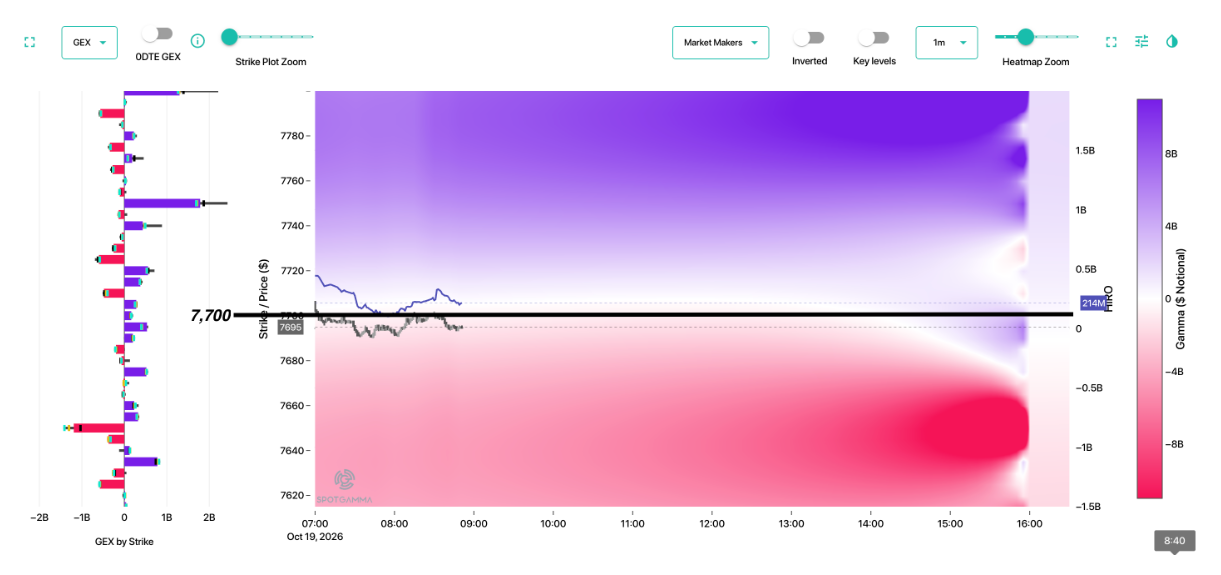
For today, our concern is that there is not a lot of support from current indicated SPX levels (7,700) down to 7,600. We will want to see positive HIRO values, a recovery of 7,700, with vol coming down in order to trust this opening bounce. The bigger picture is that if COR1M starts to creep higher with SPX <7,700, then we want to start positioning for a broader selloff, with a possible wash out into the 7,450 area. If you are already long of stocks, then this bounce may be a decent opportunity add a few Nov put spreads.

The other hot topic is that CRWV & ORCL CDS has recently surged. While that may be a credible threat to equity markets, we note pretty calm positioning in both of those names.
For CRWV there were more net calls added, likely hedging a bounce. There were also some fairly large puts bought, too, notably at the 35 strike (right side) for 2028. This does read like some real crash protection.

For ORCL, we saw both puts and calls on net reduce. If there were major issues we’d look for put protection to surge – that is not yet the case.

©2025 TenTen Capital LLC DBA SpotGamma
All TenTen Capital LLC DBA SpotGamma materials, information, and presentations are for educational purposes only and should not be considered specific investment advice nor recommendations. Futures, foreign currency and options trading contains substantial risk and is not for every investor. An investor could potentially lose all or more than the initial investment. Risk capital is money that can be lost without jeopardizing one’s financial security or lifestyle. Only risk capital should be used for trading and only those with sufficient risk capital should consider trading. Past performance is not necessarily indicative of future results. VIEW FULL RISK DISCLOSURE https://spotgamma.com/model-faq/disclaimer/
|
| /ESZ26 | SPX | SPY | NDX | QQQ | RUT | IWM |
|---|---|---|---|---|---|---|---|
| Reference Price: | $7707.45 | $7659 | $763 | $29187 | $709 | $2721 | $270 |
| SG Gamma Index™: |
| -2.977 | -0.832 |
|
|
|
|
| SG Implied 1-Day Move: |
| 0.52% | 0.52% |
|
|
|
|
| SG Implied 5-Day Move: |
| 1.15% |
|
|
|
|
|
| SG Implied 1-Day Move High: |
| After open | After open |
|
|
|
|
| SG Implied 1-Day Move Low: |
| After open | After open |
|
|
|
|
| SG Volatility Trigger™: | $7808.45 | $7760 | $769 | $29500 | $730 | $2840 | $280 |
| Absolute Gamma Strike: | $8048.45 | $8000 | $750 | $29675 | $700 | $2750 | $270 |
| Call Wall: | $8148.45 | $8100 | $800 | $29675 | $760 | $2765 | $300 |
| Put Wall: | $7698.45 | $7650 | $750 | $28000 | $700 | $2700 | $270 |
| Zero Gamma Level: | $7720.45 | $7672 | $773 | $29778 | $730 | $2840 | $291 |
| Key Support & Resistance Strikes |
|---|
| SPX Levels: [8000, 7000, 7700, 7650] |
| SPY Levels: [750, 760, 770, 765] |
| NDX Levels: [29675, 29000, 30000, 28000] |
| QQQ Levels: [700, 710, 720, 690] |
| SPX Combos: [(8027,88.44), (8012,67.04), (7996,97.35), (7981,69.93), (7973,64.57), (7950,87.42), (7928,86.20), (7912,67.26), (7897,97.59), (7882,71.48), (7874,80.76), (7866,76.34), (7859,67.41), (7851,89.26), (7843,72.66), (7828,92.80), (7820,76.52), (7813,80.45), (7797,92.12), (7790,69.15), (7774,74.58), (7751,94.56), (7728,82.07), (7713,81.04), (7698,97.88), (7690,76.86), (7682,85.25), (7675,91.35), (7667,93.71), (7659,84.59), (7652,99.84), (7644,85.25), (7636,96.68), (7629,99.10), (7621,81.94), (7613,92.63), (7606,73.53), (7598,99.50), (7591,78.94), (7583,93.55), (7575,93.51), (7568,89.87), (7560,78.14), (7552,98.41), (7545,70.84), (7537,93.73), (7529,94.14), (7522,90.01), (7506,75.90), (7499,99.38), (7483,81.92), (7476,94.65), (7468,74.70), (7453,96.26), (7437,71.37), (7422,91.69), (7407,65.43), (7399,96.89), (7376,89.27), (7353,91.62), (7338,65.16), (7322,84.82), (7299,94.97), (7292,64.76)] |
| SPY Combos: [767.08, 762.45, 779.43, 787.14] |
| NDX Combos: [28779, 29188, 28370, 27962] |
| QQQ Combos: [714.94, 699.65, 720.03, 709.84] |
|
| SPX | SPY | NDX | QQQ | RUT | IWM |
|---|---|---|---|---|---|---|
| Gamma Tilt: | 0.798 | 0.484 | 0.679 | 0.483 | 0.388 | 0.318 |
| Gamma Notional (MM): | ‑$753.158M | ‑$1.663B | ‑$10.133M | ‑$1.165B | ‑$109.924M | ‑$1.528B |
| 25 Delta Risk Reversal: | -0.062 | 0.00 | -0.081 | -0.066 | -0.054 | -0.041 |
| Call Volume: | 891.984K | 1.849M | 14.13K | 1.99M | 38.705K | 428.079K |
| Put Volume: | 1.808M | 3.371M | 13.959K | 2.634M | 61.595K | 1.068M |
| Call Open Interest: | 9.14M | 5.771M | 77.219K | 5.315M | 286.819K | 3.092M |
| Put Open Interest: | 13.404M | 12.285M | 107.76K | 7.393M | 486.346K | 7.153M |
0 comentarios