¡Estrenamos nueva web!
Aprende Opciones financieras
de la forma más sencilla
Aprende a operar con Opciones financieras en el mercado real de la mano de Ricardo Saenz de Heredia
Confían en nosotros las empresas más importantes de formación en los mercados financieros


Domina el mercado de las Opciones con cursos hechos a medida sobre estrategias concretas para distintas casuísticas y situaciones

Aprende en tiempo real dentro del Salón de Trading y comprende como aplicar en el mercado las estrategias previamente aprendidas

Comparte tu progreso y recibe seguimiento para trazar un plan y sentir que avanzas correctamente hacia tus objetivos
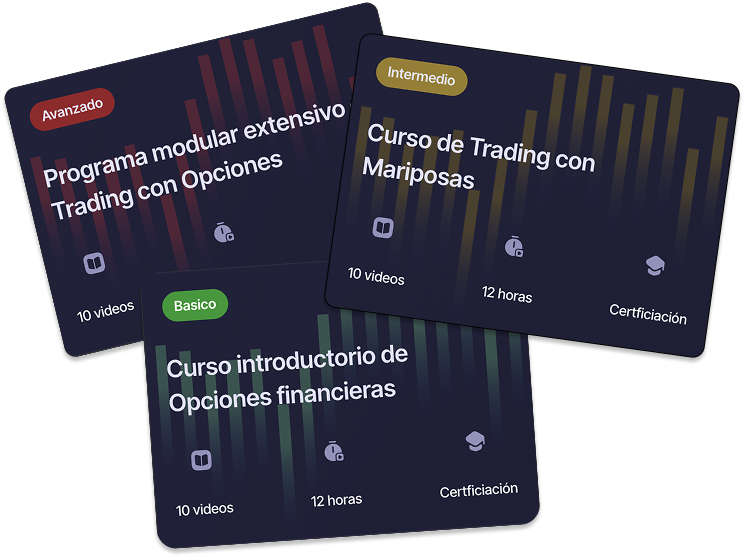
Cursos de Trading de Opciones
Domina las Opciones financieras de forma guiada, por niveles y objetivos concretos de cada curso.

Acceso al curso de por vida
Realiza el curso a tu ritmo
Desde cualquier dispositivo
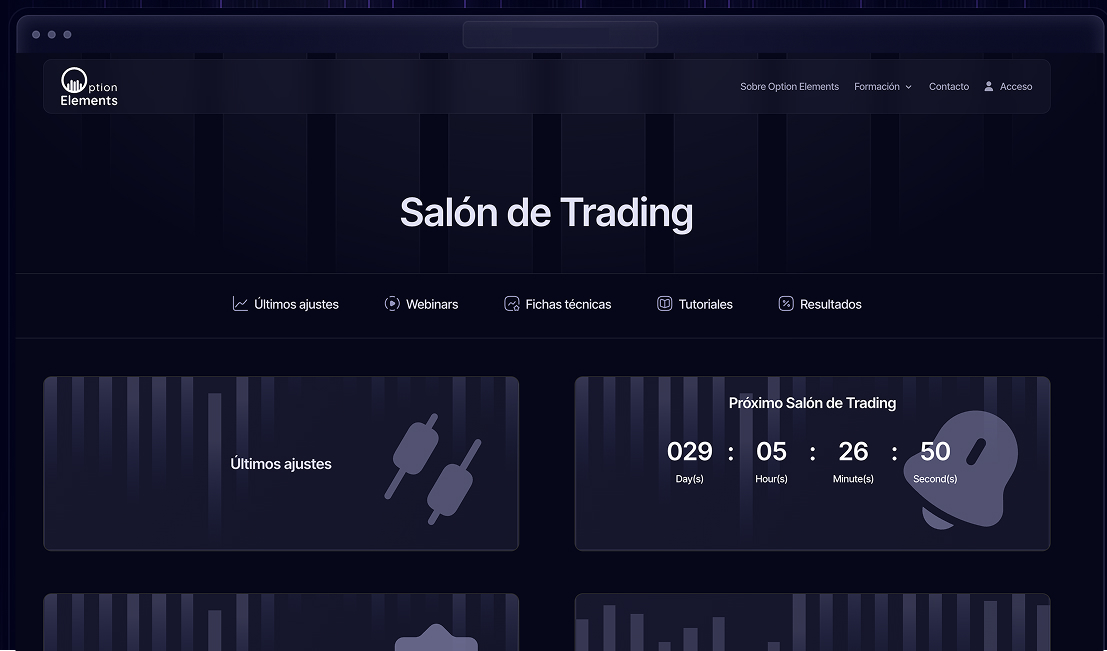
Salón de Trading
Opera de la mano de Ricardo en nuestra comunidad privada, entendiendo en tiempo real cómo aplicamos las estrategias que aprenderás con los cursos en el mercado real.
Aperturas, ajustes y cierres en directo
Directos semanales grabados
Seguimiento personalizado
Opiniones de algunos clientes
Todas las opiniones son de alumnos reales
Ricardo es un profesor excelente, explica de forma muy clara y concisa. En el Salón Virtual he podido replicar para mi cuenta personal y en tiempo real las mismas estrategias tomadas por un Trader Profesional. Esto tiene un valor incalculable para alguien que empieza! La formación junto con el Salón Virtual son lo mejor que he encontrado entre el gran número de sistemas y profesores que inundan internet.
El Salón de Option Elements es un soporte esencial si se quiere tener éxito en el trading de opciones. Además de darte mensajeas de entrada y salida, hasta ahora muy rentables, te enseñan el porqué de las mismas. Ricardo, su director, es un trader de opciones real y el mentor que todo trader hubiera querido tener. Option Elements no es sólo un curso o un servicio de señales, es mucho más…
Apreciado Ricardo; ¡Te felicito sinceramente!. Te agradezco el esfuerzo para con el curso de weeklies, no es nada fácil concentrar tanta información en tan poco tiempo. Pero te aseguro que por mi parte ha valido la pena. Supongo que por la experiencia que voy adquiriendo poco a poco, este curso se me ha hecho mucho más ameno y entendible que el primero.
Ricardo es un excelente profesor, vengo de banca privada y el me ayudó a dar el salto para dedicarme el Trading de opciones por mi cuenta. Os lo recomiendo.
Sin duda Ricardo tiene la mayor gama de cursos en Español sobre Trading de opciones. Además se nota que está activo en el mercado por su forma de explicar toda la teoría.
Ricardo me dio mentorías para dar el salto a operar en real y, con total exactitud, os aseguro que fue una de las mejores decisiones que tomé. Gracias a el perdí el miedo a operar y por fin comencé a ganar dinero en mis operaciones.
Contáctanos ahora,
estamos aquí para ayudarte
Ponemos a tu disposición un formulario de contacto para consultar cualquier tipo de duda técnica o comercial. Contestamos en menos de 24 horas, ¡prometido!