Futures were quiet overnight, holding 3800. Key SG levels were little changed. Resistance shows at 3800, 3824 & 3851. Support shows at 3756, then 3700.
Our models retain a bullish stance due to SPX trading > Vol Trigger (3865) and implied volatility declining. We’ll feel much more comfortable about this view if/when the SPX closes above 3800, which now requires traders to get on board with calls. That isn’t a “done deal” as its behavior that we’ve not seen since August.
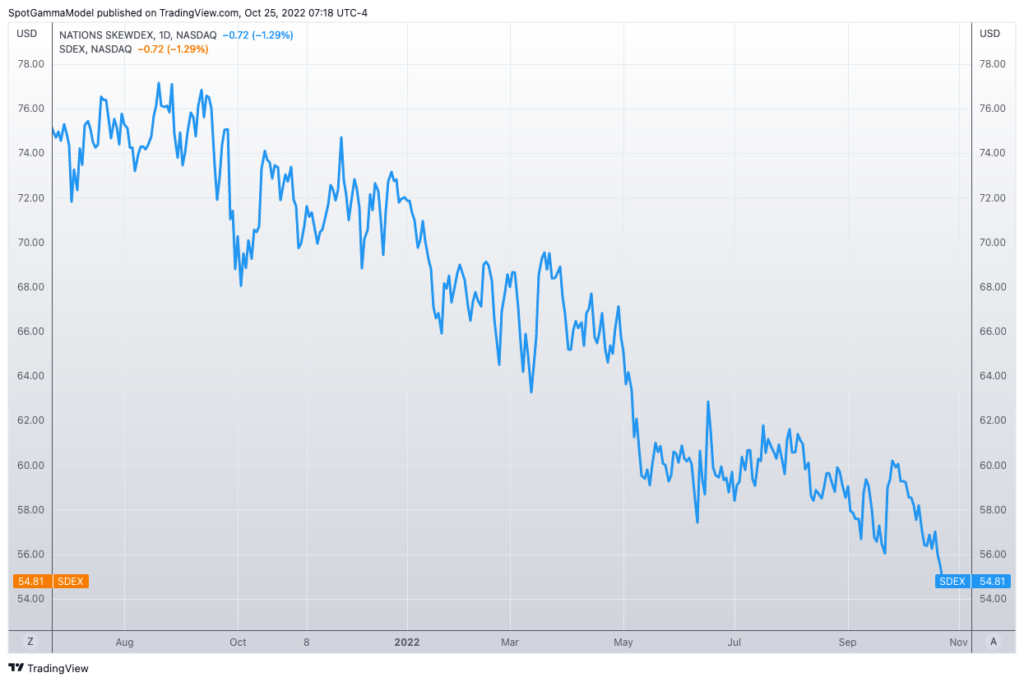
Realized volatility is starting to come down, and with that, implied volatility. This is a bullish signal for markets as it invokes a vanna tailwind. Skew continues to show no sign of bearish fears as shown by metrics like our RiskReversal (-0.04) and SDEX (shown below, explainer here).
What we need to see here is call positions entering the market. There is a risk here that markets are stalling right around the 3800 area where gamma flips from positive to negative (Vol Trigger and/or Zero Gamma). This flip point is an area of equilibrium wherein the puts that have driven the market higher have been largely burned up, and the next leg up relies on the options positioning baton being passed to calls.
The S&P needs to close >3800 for options positioning to be more of a volatility suppressant. This is because there is not much in the way of open interest between 3700 – 3800, and so markets could quickly reverse down into 3700. A move above 3800 forms that 3800 area as support, and likely draws in more call positions.
Relatedly, we yesterday discussed the that options traders are watching the positioning in OTM calls, or “upside crash protection”. Our view was that while skew is flat, that may have more to do with traders selling puts than buying calls as we have not seen a tremendous surge in call positioning.
Recall, too, that one of the core theme’s from last weeks notes was our concern around the rise of “day trading” in the options complex (here).
Shown below is SPX call volume (red) and open interest (blue), and you can see that there has been a rather impressive surge in call volumes. However, note that open interest is not moving with the same trajectory. Further, there has been a nearly equivalent surge in put volumes. Call volume not translating into open interest falls in with this theme of “day trading” as it suggests traders are not positioning for rallies over any time horizon longer than one day.

| SpotGamma Proprietary SPX Levels | Latest Data | SPX Previous | SPY | NDX | QQQ |
|---|---|---|---|---|---|
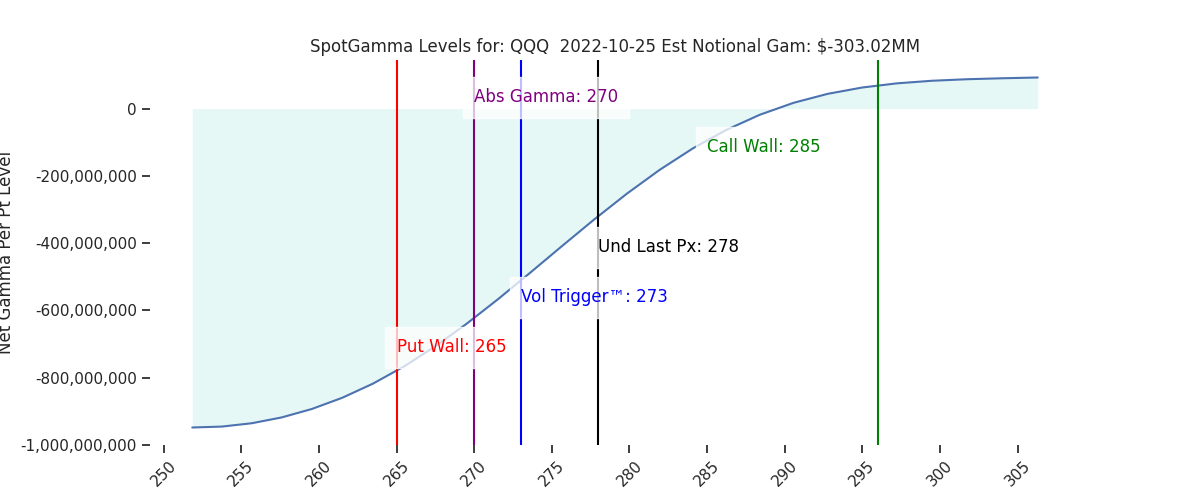
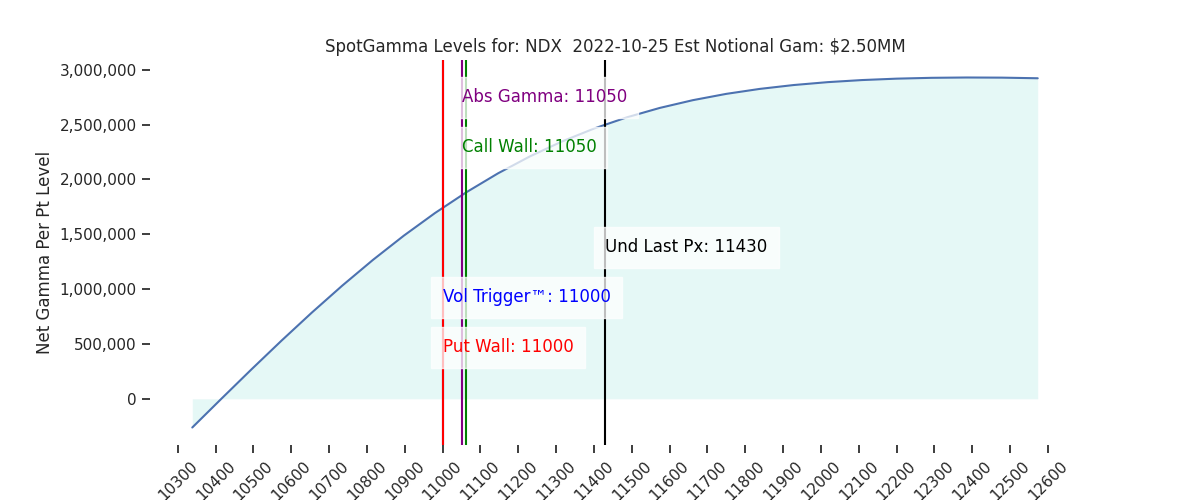
| Ref Price: | 3797 | 3797 | 378 | 11430 | 278 |
| SG Implied 1-Day Move:: | 1.31%, | (±pts): 50.0 | VIX 1 Day Impl. Move:1.88% | ||
| SG Implied 5-Day Move: | 3.09% | 3797 (Monday Ref Price) | Range: 3680.0 | 3915.0 | ||
| SpotGamma Gamma Index™: | -0.01 | -0.3 | -0.11 | 0.01 | -0.04 |
| Volatility Trigger™: | 3765 | 3725 | 375 | 11000 | 273 |
| SpotGamma Absolute Gamma Strike: | 4000 | 4000 | 380 | 11050 | 270 |
| Gamma Notional(MM): | -141.0 | -45.0 | -728.0 | 3.0 | -303.0 |
| Put Wall: | 3600 | 3600 | 360 | 11000 | 265 |
| Call Wall : | 3900 | 3900 | 385 | 11050 | 285 |
| Additional Key Levels | Latest Data | Previous | SPY | NDX | QQQ |
|---|---|---|---|---|---|
| Zero Gamma Level: | 3815 | 3815 | 387.0 | 10349.0 | 299 |
| CP Gam Tilt: | 1.0 | 0.97 | 0.74 | 1.28 | 0.78 |
| Delta Neutral Px: | 3881 | ||||
| Net Delta(MM): | $1,670,123 | $1,685,630 | $183,090 | $50,168 | $96,620 |
| 25D Risk Reversal | -0.04 | -0.05 | -0.04 | -0.05 | -0.05 |
| Call Volume | 541,742 | 639,714 | 2,087,537 | 7,588 | 776,289 |
| Put Volume | 1,013,105 | 1,077,526 | 2,933,726 | 7,373 | 901,337 |
| Call Open Interest | 6,578,613 | 6,566,843 | 7,533,780 | 58,144 | 4,508,579 |
| Put Open Interest | 10,867,793 | 10,734,863 | 13,110,759 | 54,446 | 6,632,902 |
| Key Support & Resistance Strikes: |
|---|
| SPX: [4000, 3900, 3800, 3700] |
| SPY: [380, 375, 370, 360] |
| QQQ: [300, 290, 280, 270] |
| NDX:[12500, 12000, 11500, 11050] |
| SPX Combo (strike, %ile): [(3950.0, 88.31), (3900.0, 93.08), (3851.0, 89.81), (3836.0, 87.44), (3824.0, 83.93), (3699.0, 81.28), (3650.0, 87.44)] |
| SPY Combo: [389.1, 384.17, 394.02, 364.09, 382.66] |
| NDX Combo: [10882.0, 11053.0, 11087.0] |