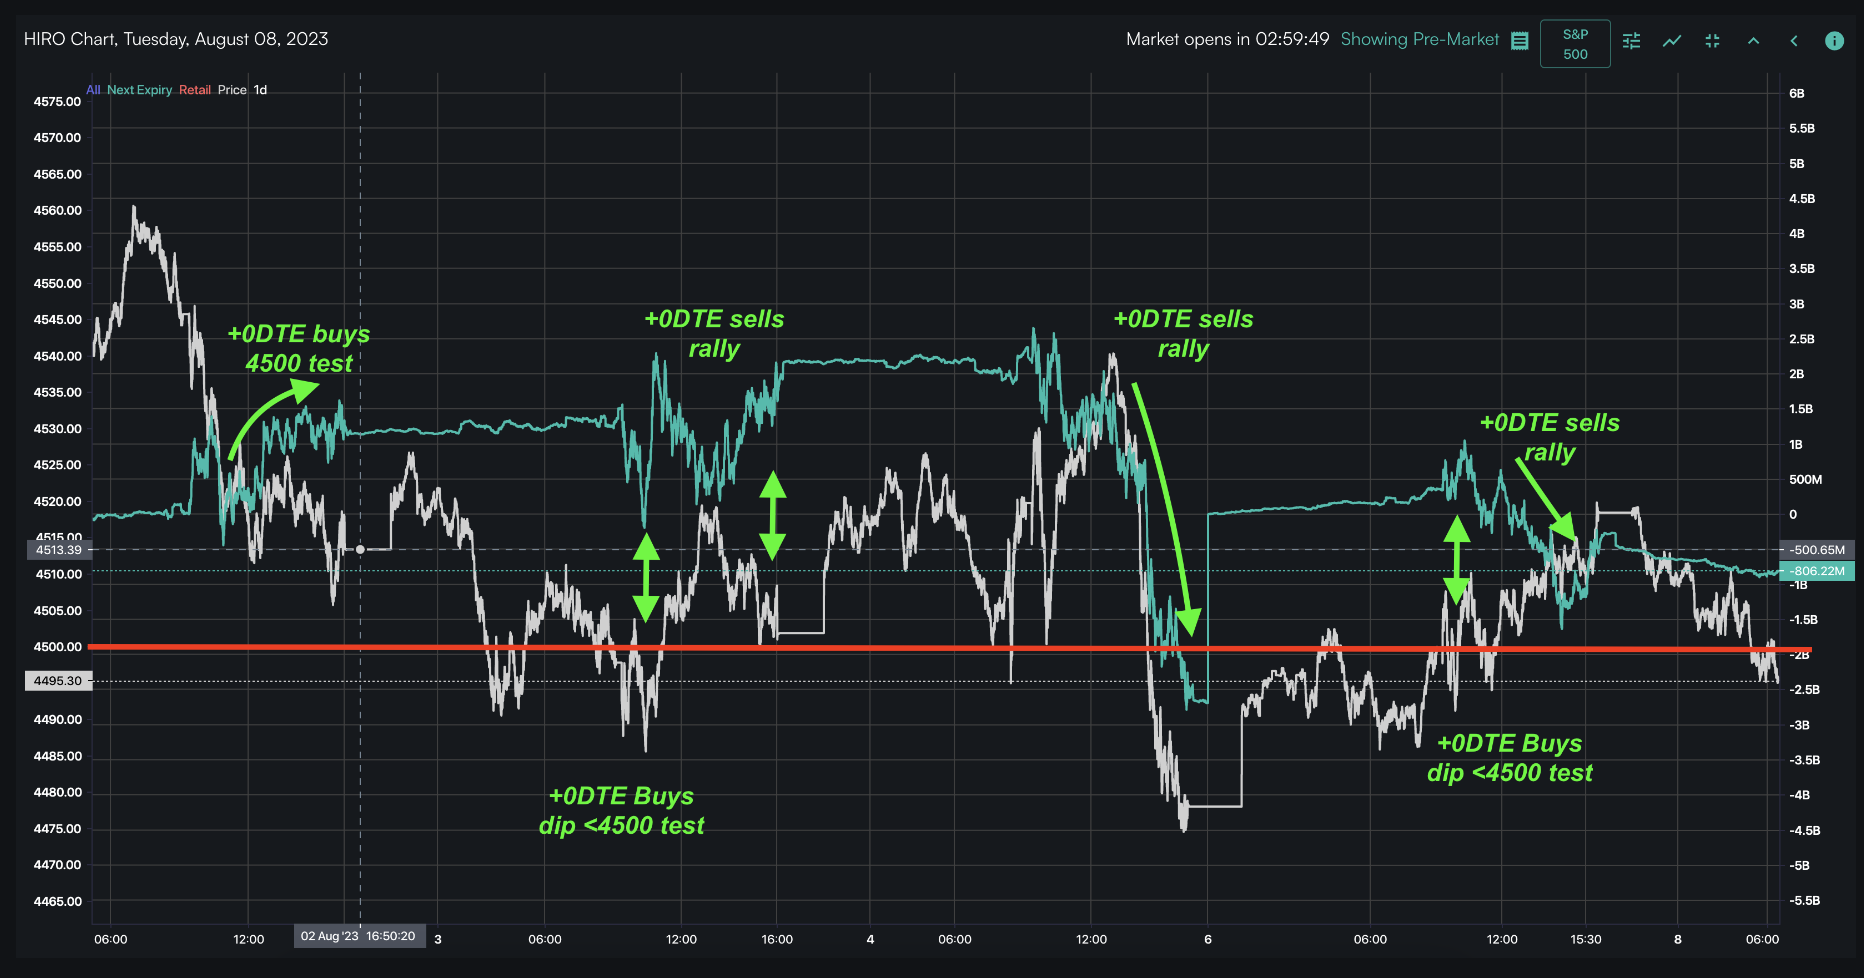
Macro Theme:
Short Term Resistance: 4,550 SPX Call Wall
Short Term Support: 4,500
Risk Pivot Level: 4,500
Major Range High/Resistance: 4,550 SPX Call Wall
Major Range Low/Support: 4,400
‣ If the NFP print is benign on 9/1, it combine with the Labor Day holiday (next Monday) to likely lead to lower Index IV’s and supported stocks over the next week.*
‣ Entering into the week of 9/11, there are a litany of catalysts including: CPI, big Sep OPEX, VIX Exp & FOMC. This suggests to us vol may be under pressure another ~2 weeks, and then risks pick up.*
‣ While we have no particular reason to be bearish, we note that a strong rally into OPEX/VIX Exp would certainly clear up the downside “padding” that we’ve been enjoying (and discussing) over the last few weeks. This could make downside into end of September/October “more available”.*
*updated 8/31
**updated 8/16
Founder’s Note:
Futures are 30bps higher to 4,530 ahead of the 8:30AM ET NFP. Resistance for today is at 4,550 – 4,560, with the SPX
Call Wall
shifting to 4,600 & SPY
Call Wall
shifting to 455. 4,600 is now the top of our range, with major resistance today at the 455 SPY
Call Wall
(4,560 SPX). Support below shows at 4,525 (SPY 452) & 4,510 (SPY 450) & 4,500. There is a support gap below 4,500 to 4,450.
For QQQ the
Call Wall
remains at 385, with first resistance at 380. Support below shows at 378 & 375.
Today’s 0DTE ATM straddle is $26 (ref: 4,525, IV = 21%), which implies the market is looking for a 57bps move on the day. Our gamma-based range estimate is 68bps (open/close range). Based on AM futures prices, the implied open is around 4,525 so a ~60bps move places the SPX at either 4,500 or 4,560 – both of which are strikes with large gamma.
For today, our base case:
With any kind of “in line” NFP print our expectation is that we see the market close in the 4,500 – 4,560 range.
Bearish view:
If the NFP prints some kind of “positive jobs” standard deviation (i.e. inverse JOLTS), then we could see a test of 4,450, but we think dip buyers/vol sellers would come in there and bring the market back towards 4,500. This bounce would be driven by the opportunity to short some volatility/collect some extra decay in front of a holiday weekend. There is a lot of gamma-padding to absorb downside, and this likely remains true into the week of 9/11. Asymmetric damage could be done to the tech high-flyers of the past week, wherein the specter of higher rates may cause more lasting damage.
Bullish view:
A number that confirms the JOLTS data likely gives another pump higher, but we do not think it would have the same thrust as Tuesday’s data. Into Tuesday there was a heavier IV premium, and that vanna fuel has since drained off. 4,560 would be the high end of what we’d look for today.
In both the neutral and bullish cases we look for implied volatility to continue its rapid descent.
To this point, every type of “indexified” volatility measurement we watch has cratered over the past week, which informs us that not only is ATM vol coming in, but skew (i.e. downside IV’s) have been smacked lower, too. This trend would likely continue with a neutral/bullish equity NFP print.
Out of today’s print we can start to look for an OPEX pin, the question is “around which strike magnet”? We’re thinking about 4,500 as a risk
pivot,
wherein an equity bullish NFP print keeps the weight of the SPX >4,500 into OPEX with targets more toward 4,550 – 4,600. A bearish NFP print rolls the market to the underside of 4,500. As you can see below there is big zone of
large gamma strikes
, from 4,400 – 4,600 and all of those are viable magnets. We think depending on the market action today, you can start to narrow the Sep OPEX week target to either 4,400 – 4,500 or 4,500 – 4,600. We think its likely in any case that today marks a relative high in IV’s.
SpotGamma Proprietary Levels |
SPX |
SPY |
NDX |
QQQ |
RUT |
IWM |
---|---|---|---|---|---|---|
Reference Price: |
$4507 |
$450 |
$15505 |
$377 |
$1900 |
$188 |
SpotGamma Implied 1-Day Move: |
0.67% |
0.67% |
|
|
|
|
SpotGamma Implied 5-Day Move: |
2.10% |
|
|
|
|
|
SpotGamma Volatility Trigger™: |
$4495 |
$451 |
$15250 |
$378 |
$1950 |
$189 |
Absolute Gamma Strike: |
$4500 |
$450 |
$15500 |
$370 |
$1900 |
$190 |
SpotGamma Call Wall: |
$4600 |
$455 |
$14625 |
$385 |
$1860 |
$192 |
SpotGamma Put Wall: |
$4300 |
$440 |
$15175 |
$350 |
$1750 |
$187 |
Additional Key Levels |
SPX |
SPY |
NDX |
QQQ |
RUT |
IWM |
---|---|---|---|---|---|---|
Zero Gamma Level: |
$4481 |
$449 |
$14453 |
$374 |
$1998 |
$194 |
Gamma Tilt: |
1.123 |
0.884 |
1.31 |
1.039 |
0.780 |
0.567 |
SpotGamma Gamma Index™: |
0.802 |
-0.135 |
0.032 |
0.013 |
-0.023 |
-0.102 |
Gamma Notional (MM): |
$180.106M |
‑$596.211M |
$4.90M |
$62.434M |
‑$17.825M |
‑$1.034B |
25 Day Risk Reversal: |
-0.033 |
-0.034 |
-0.033 |
-0.033 |
-0.026 |
-0.033 |
Call Volume: |
447.507K |
2.003M |
7.942K |
777.927K |
30.699K |
171.694K |
Put Volume: |
836.498K |
2.473M |
19.885K |
951.018K |
43.417K |
437.657K |
Call Open Interest: |
6.356M |
6.971M |
61.98K |
4.595M |
216.707K |
3.612M |
Put Open Interest: |
12.721M |
15.01M |
84.78K |
9.242M |
404.119K |
7.758M |
Key Support & Resistance Strikes |
---|
SPX Levels: [4600, 4500, 4450, 4400] |
SPY Levels: [452, 450, 447, 445] |
NDX Levels: [16500, 16000, 15500, 15000] |
QQQ Levels: [380, 375, 370, 360] |
SPX Combos: [(4724,74.36), (4701,95.50), (4674,84.36), (4665,92.30), (4652,94.88), (4625,89.17), (4602,78.55), (4598,98.55), (4593,73.16), (4580,78.70), (4575,95.45), (4571,77.87), (4566,80.27), (4562,80.38), (4557,81.16), (4553,86.58), (4548,98.18), (4544,90.80), (4539,91.63), (4535,91.47), (4530,85.39), (4526,97.39), (4499,95.18), (4494,85.13), (4485,79.87), (4476,87.26), (4454,80.74), (4427,79.90), (4413,79.16), (4404,80.89), (4399,89.68), (4377,80.65), (4354,76.27), (4350,86.59), (4323,79.05), (4305,82.49), (4300,95.56)] |
SPY Combos: [459.29, 454.33, 429.57, 469.64] |
NDX Combos: [15800, 16002, 15583, 14761] |
QQQ Combos: [386.2, 380.91, 391.12, 360.88] |
SPX Gamma Model
View All Indices Charts