Macro Theme:
Short Term Resistance: 4,400
Short Term Support: 4,300
Risk Pivot Level: 4,400
Major Range High/Resistance: 4,500
Major Range Low/Support: 4,300
‣ We target a market move <4,300 by 9/29, and would be stopped out on this view with a close >4,375.*
‣ If the SPX is <4,300 into 9/29 exp, it may mark a major short term low, as put positioning hits extreme highs.*
*updated 9/25
Founder’s Note:
Futures are flat to 4,358. For SPX, support is at 4,324, 4,315 & 4,300. Resistance is at 4,350 then 4,400. Our daily range estimate holds at 0.82% (open/close).
This week traders will be watching Thursdays GDP, and PCE on Friday.
Currently the SPX term structure is in backwardation, which is a state of fear. Below is the term structure for today vs 1 week ago, wherein traders were betting that Powell would do little to stir volatility.
Short dated IV’s are now in the 16-18% range, implying traders are anticipating +1% moves in the S&P500. Based on our models, we think IV’s are a bit too high.

We continue to look for the market to remain under pressure this week, with prices sliding lower in a “controlled descent”. In the gamma space we are negative, which should continue to place directional pressure on price action. In the volatility space a premium is building, which suggests vanna flows are impactful as higher IV’s add negative delta hedging flows. Post-FOMC the market is stuck in a “negative” feedback with both gamma + vanna contributing to lower S&P prices. Something needs to happen to snap that feedback loop.
Those two triggers are:
- Friday OPEX
- SPX move above >4,375
Again, while we look for markets to head lower, we do not think the S&P it at risk of a major, sharp flush lower. Consider on Thursday the SPX was -1% from open to close, and -0.55% on Friday – these are not violent declines. These smaller moves certainly add up over the course of several days, but they fail to meaningfully spark volatility (i.e. VIX >20). Additionally, consider our SG Implied Move at 0.82% which speaks to contained volatility – this figure was often in the ~1.5% range in ’22.
This is why we think traders that are short should stick to negative deltas vs long vega (per last Tuesday’s note).
Zooming out, ideally the S&P moves into the 4200 level through Friday, wherein the removal of large JPM collar positions could provide fuel for a bounce higher. This could provide the trigger to flip those gamma & vanna flows from downward pressure, to upward pressure.
Drilling into the two key dynamics of gamma/vanna:
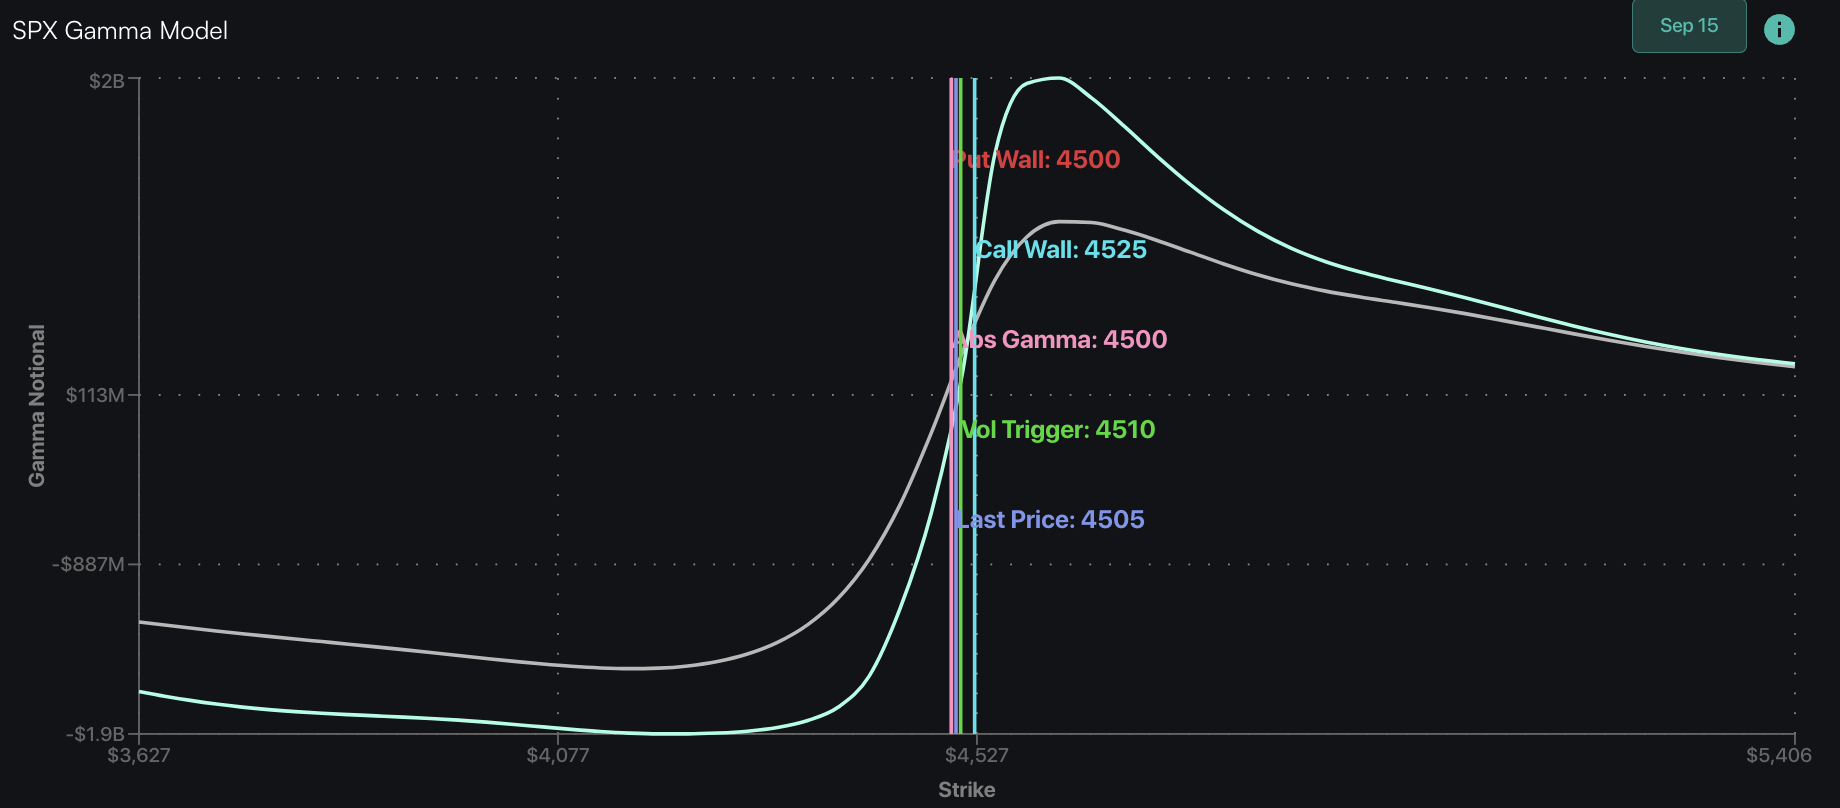
First, we look at gamma. As discussed on Friday, the positioning is hitting negative extremes as shown in the Tilt (chart) and gamma curves (below). The implication here is that there isn’t a whole lot more downside hedging pressure to be offered, and we’ll be on the lookout for a roll lower in the
Put Wall
(s) to open up further downside. The
Put Wall
s are unchanged from Friday for SPX/SPY & QQQ, which are at 4,300/430 & 350.
The gamma curves will not change materially until, at best, Friday’s OPEX, which currently holds ~5-10% of total delta & gamma. Should the market slide lower, that percentage would increase and make Friday’s expiration more meaningful. It would then likely be a better upside trigger into October.

In terms of the volatility premium, we can see the VIX is now fairly elevated vs SPX realized volatility. This informs us that there is some demand for downside protection and/or covering of short puts. We’re sure there are traders waiting to extract this premium (i.e. short vol), and the adjustment of options positions on Friday could spark upside that would give vol sellers that signal.

Should the equity market follow through with lower prices into Friday, it lays out for a nice rally to start October. However, if we this week rally into >4,400, it makes the start of October much less clear. This is because the fuel provided by gamma & vanna are pulled forward from less extreme levels (i.e. gamma/vanna are even stronger on a move to 4,200).
| SpotGamma Proprietary Levels | SPX | SPY | NDX | QQQ | RUT | IWM |
|---|---|---|---|---|---|---|
| Reference Price: | $4320 | $430 | $14701 | $357 | $1776 | $176 |
| SpotGamma Implied 1-Day Move: | 0.82% | 0.82% |
|
|
|
|
| SpotGamma Implied 5-Day Move: | 2.21% |
|
|
|
|
|
| SpotGamma Volatility Trigger™: | $4480 | $442 | $15175 | $368 | $1830 | $185 |
| Absolute Gamma Strike: | $4300 | $430 | $15250 | $360 | $1850 | $180 |
| SpotGamma Call Wall: | $4600 | $450 | $15250 | $400 | $1855 | $210 |
| SpotGamma Put Wall: | $4300 | $430 | $13000 | $350 | $1700 | $175 |
| Additional Key Levels | SPX | SPY | NDX | QQQ | RUT | IWM |
|---|---|---|---|---|---|---|
| Zero Gamma Level: | $4426 | $442 | $14774 | $371 | $1939 | $193 |
| Gamma Tilt: | 0.520 | 0.423 | 0.879 | 0.532 | 0.495 | 0.315 |
| SpotGamma Gamma Index™: | -3.035 | -0.66 | -0.014 | -0.201 | -0.041 | -0.133 |
| Gamma Notional (MM): | ‑$1.413B | ‑$2.88B | ‑$1.517M | ‑$1.049B | ‑$44.064M | ‑$1.434B |
| 25 Day Risk Reversal: | -0.044 | -0.034 | -0.04 | -0.039 | -0.037 | -0.041 |
| Call Volume: | 559.921K | 2.123M | 10.52K | 819.017K | 9.513K | 226.015K |
| Put Volume: | 1.198M | 2.836M | 15.324K | 1.13M | 32.761K | 478.621K |
| Call Open Interest: | 5.724M | 6.442M | 48.22K | 4.147M | 179.788K | 3.025M |
| Put Open Interest: | 11.936M | 11.959M | 78.202K | 7.864M | 349.123K | 6.561M |
| Key Support & Resistance Strikes |
|---|
| SPX Levels: [4500, 4400, 4300, 4000] |
| SPY Levels: [440, 435, 430, 420] |
| NDX Levels: [15500, 15250, 15000, 14000] |
| QQQ Levels: [370, 360, 355, 350] |
| SPX Combos: [(4523,73.24), (4502,84.48), (4402,89.35), (4376,75.78), (4359,77.57), (4350,97.80), (4342,84.11), (4329,84.25), (4324,94.85), (4320,86.64), (4316,98.72), (4311,89.09), (4307,88.03), (4298,99.82), (4294,89.16), (4290,89.54), (4285,88.02), (4281,88.23), (4277,96.09), (4268,88.27), (4264,92.59), (4260,78.81), (4255,85.32), (4251,98.48), (4238,86.59), (4234,75.93), (4225,93.07), (4216,92.22), (4212,95.42), (4199,99.35), (4173,73.34), (4160,73.43), (4152,91.99), (4126,86.56)] |
| SPY Combos: [427.37, 417.47, 432.53, 422.63] |
| NDX Combos: [14378, 15245, 14583, 14789] |
| QQQ Combos: [350.09, 355.11, 371.57, 345.08] |
SPX Gamma Model
View All Indices Charts