Macro Theme:
Short Term Resistance: 4,300
Short Term Support: 4,240
Risk Pivot Level: 4,325
Major Range High/Resistance: 4,400
Major Range Low/Support: 4,200
‣ We target a market move <4,300 by 9/29, and would be stopped out on this view with a close >4,325.*
‣ If the SPX is <4,300 into 9/29 exp, it may mark a major short term low, as put positioning hits extreme highs.*
*updated 9/27
Founder’s Note:
ES Futures are flat at 4,317. Key SG levels for the SPX are:
- Support: 4,266, 4,250, 4,240, 4,225 & 4,300
- Resistance: 4,275, 4,300, 4,313
- 1 Day Implied Range: 0.85%
SPY & SPX
Put Walls
are unchanged from yesterday, at 425 (SPX = 4,266) & 4,200, respectively. We read this as a mildly bullish indication.
For QQQ, support holds at the 350
Put Wall,
with resistance at 355, then 360.
Today traders are watching CORE PCE & GDP out at 8:30 AM ET.
Once again it seemed the SPX was yesterday poised for a landslide-style drop into the close, but the put buyers let up into 1:30 and the SPX ripped 1% higher, into 4,290. While this mean reversion was strong, it did not fix our negative gamma/vanna dynamics. Said another way, the strength of the bounce yesterday was a sympotom of options positioning, and not the clearing of options positionings. Equities are still “sick” and unstable until we either: 1) Friday’s close, 2) SPX recovery of 4,325.
As you can see below the current SPX term structure (pink) is only slightly under that of the prior session (gray), and the curve is still in backwardation. A flat to backwardated structure is a signal of market angst.
Additionally, we’ve labeled key events along the X axis, and you can see how IV’s are elevated on those days – particularly today & tomorrow. This signals that a big deviation from GDP/PCE this week could trigger high volatility in markets.
We continue to be looking for ways to structure short term, upside bets into next week under the idea that markets may put in a short term bottom by EOD Friday. As per yesterday we think its imperative to used fixed risk trades (i.e. no naked short puts) to express upside views.

Pivot
ing slightly, we are getting a lot of inquiries about this chart from GS, which shows negative SPX gamma at its highest level, ever (h/t ZH).
Ultimately this entire exercise of tracking dealer gamma flows is about forecasting how much volatility those flows invoke. Therefore, one might infer that if there is indeed record negative gamma, we should have (or be on the lookout for) record volatility (or at least significant volatility).
Many of our recent notes have focused on these dealer gamma dynamics (ex: y’days note), and our view was & is that gamma is not setup to materially drive volatility (its elevated, but its not a bust-out). This may matter for the vol you’re willing to pay, and we are unsure that generally looking for much higher IV’s here is warranted.

| SpotGamma Proprietary Levels | SPX | SPY | NDX | QQQ | RUT | IWM |
|---|---|---|---|---|---|---|
| Reference Price: | $4274 | $426 | $14580 | $355 | $1778 | $175 |
| SpotGamma Implied 1-Day Move: | 0.85% | 0.85% |
|
|
|
|
| SpotGamma Implied 5-Day Move: | 2.21% |
|
|
|
|
|
| SpotGamma Volatility Trigger™: | $4360 | $430 | $15025 | $362 | $1820 | $185 |
| Absolute Gamma Strike: | $4300 | $430 | $15250 | $350 | $1850 | $175 |
| SpotGamma Call Wall: | $4500 | $450 | $15250 | $400 | $1880 | $210 |
| SpotGamma Put Wall: | $4200 | $425 | $13000 | $350 | $1700 | $175 |
| Additional Key Levels | SPX | SPY | NDX | QQQ | RUT | IWM |
|---|---|---|---|---|---|---|
| Zero Gamma Level: | $4379 | $435 | $14764 | $365 | $1899 | $189 |
| Gamma Tilt: | 0.562 | 0.472 | 0.849 | 0.575 | 0.514 | 0.334 |
| SpotGamma Gamma Index™: | -2.813 | -0.626 | -0.018 | -0.192 | -0.04 | -0.139 |
| Gamma Notional (MM): | ‑$1.394B | ‑$2.743B | ‑$2.459M | ‑$1.02B | ‑$43.022M | ‑$1.515B |
| 25 Day Risk Reversal: | -0.041 | -0.032 | -0.038 | -0.036 | -0.033 | -0.022 |
| Call Volume: | 657.439K | 2.568M | 11.242K | 1.052M | 29.097K | 294.598K |
| Put Volume: | 1.165M | 4.379M | 11.403K | 1.348M | 31.90K | 1.133M |
| Call Open Interest: | 6.098M | 7.093M | 51.214K | 4.518M | 184.757K | 3.25M |
| Put Open Interest: | 11.89M | 12.313M | 81.112K | 8.109M | 354.587K | 6.667M |
| Key Support & Resistance Strikes |
|---|
| SPX Levels: [4400, 4300, 4200, 4000] |
| SPY Levels: [430, 425, 424, 420] |
| NDX Levels: [15500, 15250, 15000, 14500] |
| QQQ Levels: [370, 360, 355, 350] |
| SPX Combos: [(4326,83.33), (4313,93.78), (4300,99.39), (4292,86.69), (4283,79.63), (4279,82.03), (4275,90.31), (4270,87.89), (4266,95.11), (4262,76.88), (4253,87.98), (4249,98.90), (4245,78.38), (4240,90.69), (4236,74.67), (4232,91.02), (4223,96.90), (4219,84.28), (4215,96.84), (4210,98.64), (4202,99.81), (4189,72.65), (4185,73.88), (4180,79.54), (4176,82.77), (4172,78.64), (4163,81.70), (4159,79.67), (4151,94.15), (4125,85.70), (4112,83.58), (4099,98.17), (4074,78.37)] |
| SPY Combos: [418.79, 428.59, 423.47, 419.64] |
| NDX Combos: [14376, 15251, 14581, 14172] |
| QQQ Combos: [350.74, 372.04, 355.71, 345.77] |
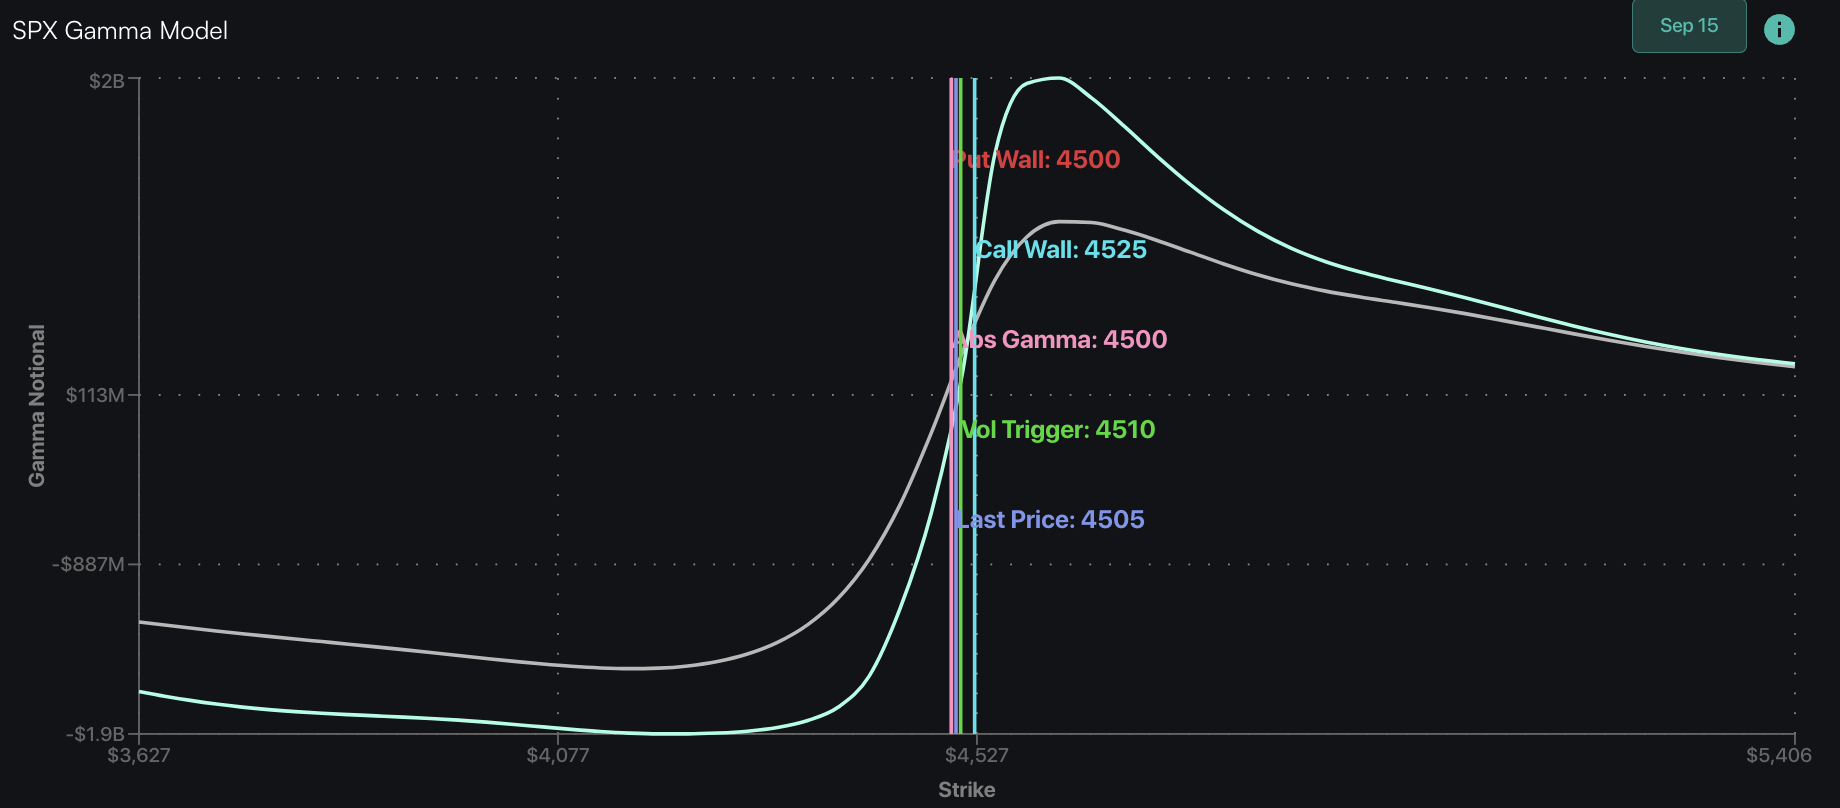
SPX Gamma Model
Strike: $4,186
- Next Expiration: -$1,881,793,946
- Current: -$2,010,146,358
View All Indices Charts