Macro Theme:
Short Term SPX Resistance: 4,400
Short Term SPX Support: 4,300
SPX Risk Pivot Level: 4,315
Major SPX Range High/Resistance: 4,400
Major SPX Range Low/Support: 4,200
‣ We look for a range pin in the 4,300 – 4,400 into 10/18 VIX exp.*
‣ A window for equity weakness opens on Wed 10/18*
‣ 4,400 SPX is likely max upside into OPEX*
‣ 4,200 SPX is the Oct OPEX downside target if 4,300 is breached*
*updated 10/16
Founder’s Note:
ES Futures are flat at 4,396. Key SG levels for the SPX are:
- Support: 4,350 & 4,300
- Resistance: 4,374 & 4,400
- 1 Day Implied Range: 0.78%
In QQQ, support is at 365, with resistance at 369/370 & 375.
We note retail sales at 8:30AM ET which traders are watching this AM. There is also a lot of Fed-speak[FS] today: Bowman 9:20AM ET, Barkin 10:45, and Kashkari 5pm.
Today is the last day wherein we mark material options support for equities. There are a few elements that play into this:
- VIX expiration Wednesday + FS: Waller, Williams, Bowman, Harker, Cook (see the full breakdown on the dashboard’s Event calendar with “Medium” Impact settings)
- Powell’s on Thursday + other FS: Jefferson, Goolsbee, Barr, Bostic, Harker
- NFLX/TSLA earnings on Thursday PM
- OPEX on Friday
This does not have to mean that equities experience a sharp decline (thats up to FS & earnings), its just that the gamma/charm & vanna (all the buzzwords!) support which has buoyed equities is like to release. Therefore that 4,300 support area becomes more suspect.
Why tomorrow, and not today? In yesterday’s AM note we outlined why we favored a VIX decline following Friday’s artificial bid, and leading into tomorrows OPEX. That is/was supportive for equities, and we think a key driver of the 77bps intraday SPX rally (+1.06% close to close). Shown below is VIX interest for tomorrows exp, and you can see that the largest put strike is 15, and we think this is an incentive for VIX to remain under pressure today. This should buoy equities into tomorrow.

How strong was the vanna effect, yesterday? Last week we showed a chart showing the strong correlation between 10 year yields, and the VIX. Highlighted in red is a clear short term divergence, as 10Y yields (blue) moved back to recent highs near 4.8%, while the VIX dropped lower (candle plot). The VIX decline was largely to due the conflict-bid unwind from Friday, and, we believe, bolstered by the upcoming VIX expiration. In other words: the VIX link has broken its trend with yields in the short term due to expiration dynamics.
If upcoming data + FS do little to assuage rate concerns, then we risk a quick VIX snapback which could coincide with lower equity prices. Added to this are the increased geopolitical concerns which could bring a VIX bid into next weekend.

As for the upside, the level we are specifically keying off of is 440 SPY (4,410 SPX). This is the biggest gamma strike on the board for OPEX, and we think a level that will take real “punch” to break before Friday. As such, our baseline case is that rallies this week may stall and pin into this large 440 gamma level. With the litany of FS + data it is, of course, possible and so we will be closely monitoring IV’s for signals of call bids into any rally.

| SpotGamma Proprietary Levels | SPX | SPY | NDX | QQQ | RUT | IWM |
|---|---|---|---|---|---|---|
| Reference Price: | $4373 | $436 | $15166 | $369 | $1746 | $173 |
| SpotGamma Implied 1-Day Move: | 0.78% | 0.78% |
|
|
|
|
| SpotGamma Implied 5-Day Move: | 2.11% |
|
|
|
|
|
| SpotGamma Volatility Trigger™: | $4355 | $436 | $15040 | $369 | $1780 | $185 |
| Absolute Gamma Strike: | $4400 | $440 | $15250 | $370 | $1800 | $175 |
| SpotGamma Call Wall: | $4450 | $440 | $15250 | $380 | $1800 | $190 |
| SpotGamma Put Wall: | $4300 | $425 | $14800 | $345 | $1750 | $170 |
| Additional Key Levels | SPX | SPY | NDX | QQQ | RUT | IWM |
|---|---|---|---|---|---|---|
| Zero Gamma Level: | $4348 | $438 | $14789 | $371 | $1850 | $182 |
| Gamma Tilt: | 1.054 | 0.768 | 2.128 | 0.837 | 0.573 | 0.410 |
| SpotGamma Gamma Index™: | 0.330 | -0.245 | 0.136 | -0.079 | -0.04 | -0.127 |
| Gamma Notional (MM): | $21.276M | ‑$1.079B | $13.439M | ‑$382.294M | ‑$42.043M | ‑$1.416B |
| 25 Day Risk Reversal: | -0.06 | -0.046 | -0.058 | -0.05 | -0.048 | -0.043 |
| Call Volume: | 589.929K | 1.546M | 6.305K | 732.487K | 19.945K | 324.101K |
| Put Volume: | 1.111M | 3.194M | 8.523K | 1.213M | 29.25K | 885.962K |
| Call Open Interest: | 6.856M | 7.253M | 56.725K | 4.733M | 229.914K | 3.578M |
| Put Open Interest: | 13.25M | 13.664M | 86.309K | 8.791M | 390.301K | 7.087M |
| Key Support & Resistance Strikes |
|---|
| SPX Levels: [4450, 4400, 4350, 4300] |
| SPY Levels: [440, 435, 430, 425] |
| NDX Levels: [15500, 15250, 15100, 15000] |
| QQQ Levels: [375, 370, 365, 360] |
| SPX Combos: [(4570,76.07), (4549,96.95), (4522,85.66), (4514,91.94), (4496,97.74), (4470,82.59), (4465,79.71), (4461,72.59), (4457,76.79), (4452,72.80), (4448,99.55), (4444,78.98), (4435,82.72), (4426,79.41), (4422,97.40), (4417,83.62), (4413,83.00), (4409,78.83), (4395,99.31), (4391,75.12), (4374,90.94), (4339,80.55), (4321,92.11), (4312,89.32), (4304,74.94), (4295,98.28), (4286,82.70), (4277,83.19), (4273,91.89), (4269,80.99), (4264,84.08), (4247,95.66), (4221,84.18), (4212,81.73), (4199,97.67)] |
| SPY Combos: [422.95, 443.44, 448.24, 433.41] |
| NDX Combos: [15227, 14787, 15606, 14984] |
| QQQ Combos: [376.13, 353.96, 364.31, 359.13] |
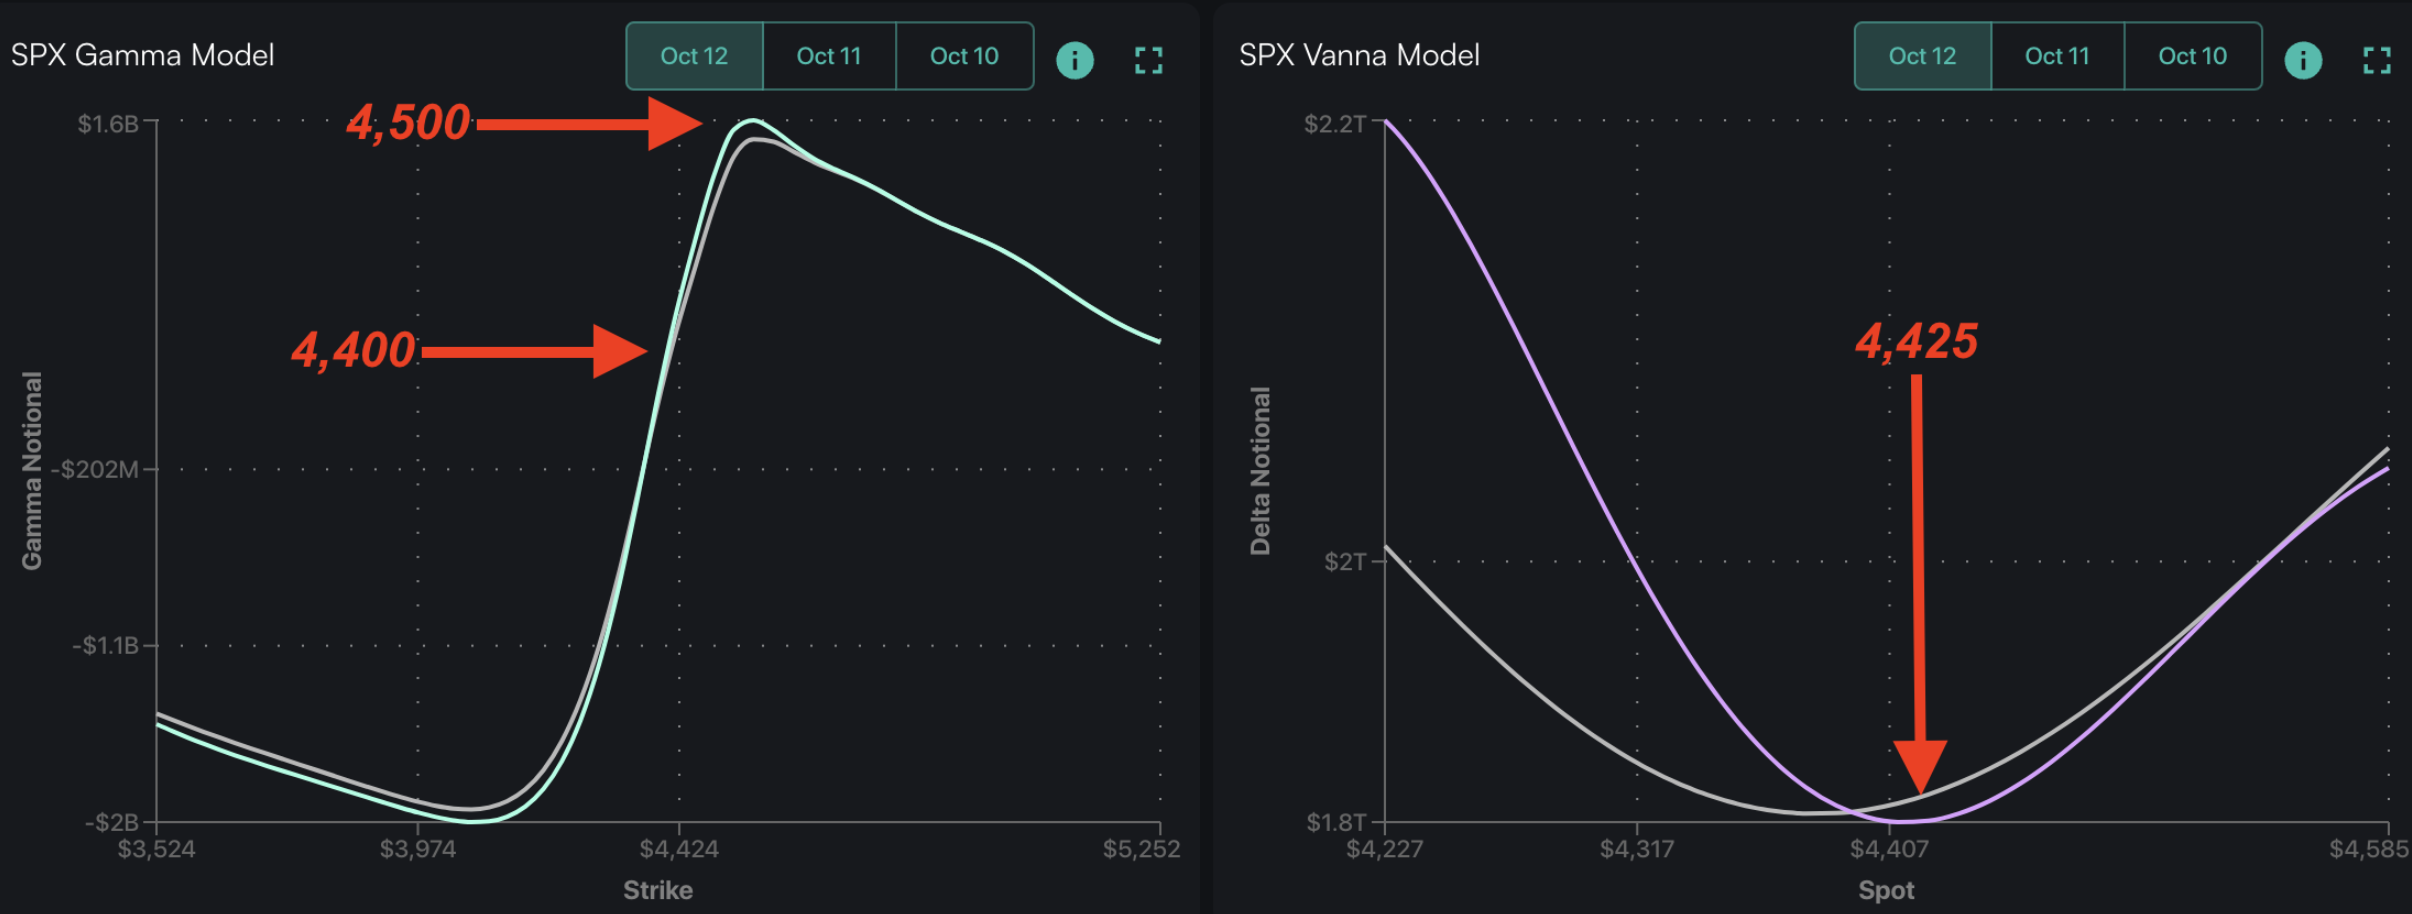
SPX Gamma Model
View All Indices Charts