Macro Theme:
Short Term SPX Resistance: 4,300
Short Term SPX Support: 4,200
SPX Risk Pivot Level: 4,220
Major SPX Range High/Resistance: 4,300
Major SPX Range Low/Support: 4,000
‣ Nov 1st FOMC is a major turning point for equities*
‣ We view 4,000 as a major support level for the S&P500 into Nov OPEX*
‣ 4,300 is first target over 1-2 sessions if we close >4,200 on 11/1/23*
*updated 11/1
Founder’s Note:
ES Futures are 50bps higher to 4,277. Key SG levels for the SPX are:
- Support: 4,250, 4,200
- Resistance: 4,300
- 1 Day Implied Range: 0.82%
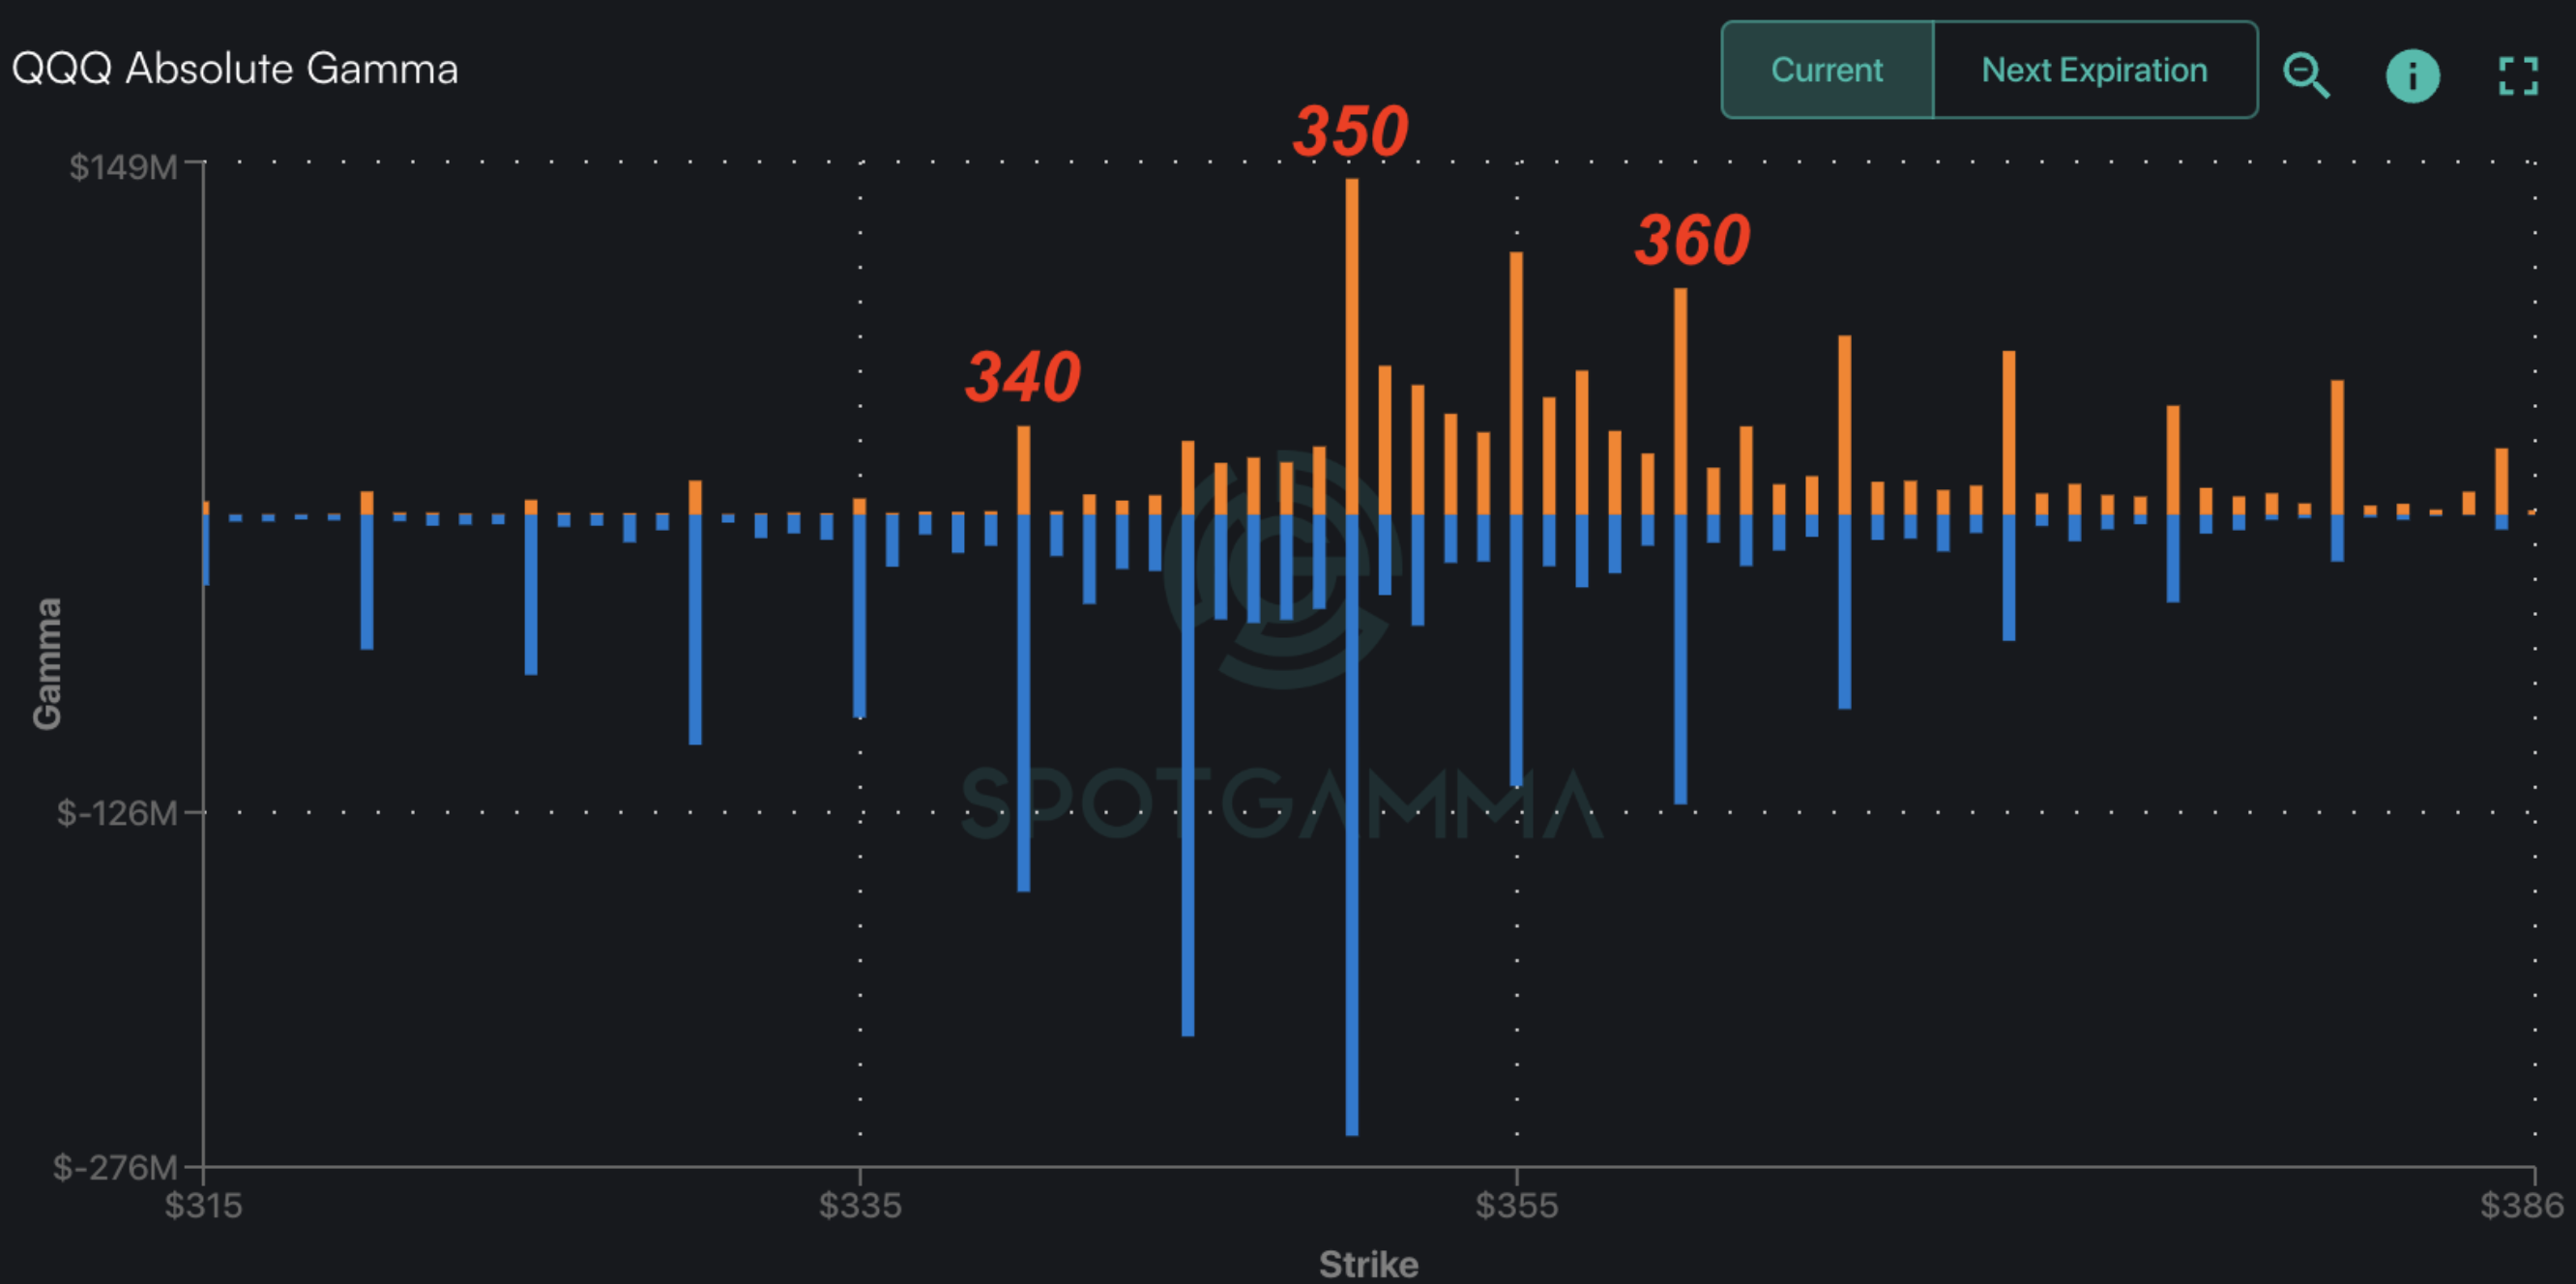
For QQQ, support is at 357 & 350, with resistance at 360.
The vol crush is on, as we see the VIX at 16.5 this morning. This has fueled futures higher, but that fuel is now running low. This does not mean equities have to reverse, but the rate of acceleration is likely to slow. Its akin to getting on the highway, speeding down the on-ramp at 65mph, only to hit congestion when you enter the highway. You can still move forward down the road, but its a slower stop and go.
The fuel provided to the market from IV/VIX declining and expanding is vanna. This fuel can be a turbo boost, or simply offering a gentle tailwind. There are a few ways for us to estimate the effect. First, shown below is the spread between VIX and 1-month SPX realized volatility(RV). Last Friday, with traders bidding up IV into the weekend, this metric pushed higher towards the blue dashed line. This informed us there was a lot of volatility premium – that is the spread between VIX and RV was large. This week, the VIX/IV has been crushed, which has now pushed that premium under its historic mean, which suggests that the VIX is now “fairly valued”. The drop in this metric also informs us that vanna-fuel was a big boost.
The drop in this metric since Friday also syncs with an S&P500 that is +3% since Friday’s close.
We should also note here that the VIX can continue to decline and remain fairly valued, but that requires a decline in realied volatility (i.e. the SPX has to start pinning). This keeps a gentle vanna tailwind in place, and is certainly a viable option if the SPX can stay >= current levels, particularly into Nov OPEX.

Another unique way to view this is through our vanna model. The purple line shows theoretical dealer delta notional – the dollar value that has to be hedged. The gray line is pure delta, which holds a static IV. The purple line is an IV adjusted delta – that is it adjusts deltas for likely changes in IV. As you can see, the purple model troughs at 4,300. This implies that at 4,300 the lift from vanna largely turns off.

For a bit more on these flows, checkout a video we posted last night.
Before you click away, there is another key concept here – and that is of positive and negative gamma.
On net we believe dealers are long options delta. This means that their options portfolio gains value when the market goes up, and loses value when the market goes down (i.e. its a positive delta position). The way this is hedged is to carry a set of short stock and/or short futures positions. These short positions offset the change in options value from the movement of the underlying stock (this is delta hedging). As stocks shift around, the amount of futures bought and sold has to adjust, which is gamma.
Our proprietary
gamma flip
point, the Vol Trigger, is at 4225. We are generally bullish above this level, and bearish below. Under the hood what this represents is how dealers may be hedging their positions. In a negative gamma environment dealers are hedging with markets. As equities decline, dealers sell more futures, and as equities rally, they buy futures back. This flow expands volatility, as dealer these dealer hedging flows push the market in various directions.
In a positive gamma environment, that is when we are >Vol Trigger, dealers start to sell futures into equity rallies, and buy futures into weakness. This suppresses stock volatility/trading ranges as these big dealer flows buy into weakness, and sell into strength.
Coming into yesterday, we had been in a negative gamma environment. This means that as equities rallied, dealers likely had to buy stock/futures to maintain hedges. This is compounded by the decline in IV, which adds dealer deltas to buy (this is the vanna flow). This flow is akin to short covering in that it is forced buying into higher markets. This forced buying is because dealers options positions are gaining back value as the market rallies and IV drops.
So, if you were short, say 1,000 futures with the SPX at 4,150 & VIX 20, you only need to be short 500 futures with SPX at 4,250 and VIX at 16. This buyback of futures boosts stocks.
Now that we are >Vol Trigger, and have waning vanna fuel, the rally may lose momentum as this short covering flow winds down.
Why does all of this matter?
It’s been our view that the crushing of IV would spark a sharp rally. Powell did not stop the IV decline, which cleared the way for a test into 4,300. However, that IV crush and associated short covering is running out of steam. So, some other flow has to come in to carry the bullish baton. These can be options flows, macro flows – whatever…but without them we do not see anything to support equities back down to 4,200.
The way that we will be assessing the stability of this rally is through an increase in positive gamma, which comes from options positions filling in around current SPX prices. This will be reflected in a decline in our
SG Implied 1-Day Move,
and a shift higher in our key levels like the Vol Trigger and
Put Wall.
As we see a possible slowing in SPX momentum ahead, traders may want to select longs in stocks which had accrued larger relative put flows, like IWM and Mag7. The collapse of larger relative put flows may offer extended relative rallies/more momentum.
Take AAPL, for example, which has ~3% of space from current premarket levels (175) to its 180 strike
Call Wall
vs the SPX which as ~1% to heavy 4,300 resistance.

|
SpotGamma Proprietary Levels |
SPX |
SPY |
NDX |
QQQ |
RUT |
IWM |
|---|---|---|---|---|---|---|
|
Reference Price: |
$4237 |
$422 |
$14663 |
$357 |
$1669 |
$165 |
|
SpotGamma Implied 1-Day Move: |
0.81% |
0.81% |
|
|
|
|
|
SpotGamma Implied 5-Day Move: |
2.39% |
|
|
|
|
|
|
SpotGamma Volatility Trigger™: |
$4225 |
$421 |
$14525 |
$355 |
$1750 |
$171 |
|
Absolute Gamma Strike: |
$4300 |
$420 |
$14600 |
$350 |
$1700 |
$165 |
|
SpotGamma Call Wall: |
$4400 |
$430 |
$14600 |
$380 |
$1690 |
$166 |
|
SpotGamma Put Wall: |
$4000 |
$400 |
$14000 |
$345 |
$1700 |
$160 |
|
Additional Key Levels |
SPX |
SPY |
NDX |
QQQ |
RUT |
IWM |
|---|---|---|---|---|---|---|
|
Zero Gamma Level: |
$4245 |
$425 |
$14299 |
$362 |
$1796 |
$174 |
|
Gamma Tilt: |
0.900 |
0.739 |
1.203 |
0.820 |
0.607 |
0.514 |
|
SpotGamma Gamma Index™: |
-0.598 |
-0.244 |
0.025 |
-0.076 |
-0.031 |
-0.099 |
|
Gamma Notional (MM): |
‑$406.43M |
‑$1.22B |
$3.576M |
‑$434.478M |
‑$32.969M |
‑$1.18B |
|
25 Day Risk Reversal: |
-0.048 |
-0.034 |
-0.05 |
-0.037 |
-0.037 |
-0.032 |
|
Call Volume: |
616.591K |
1.851M |
7.887K |
1.067M |
31.627K |
577.329K |
|
Put Volume: |
1.091M |
3.206M |
12.046K |
1.306M |
39.591K |
1.295M |
|
Call Open Interest: |
6.965M |
7.373M |
56.744K |
4.793M |
247.61K |
4.279M |
|
Put Open Interest: |
12.493M |
12.778M |
70.523K |
8.101M |
398.744K |
7.277M |
|
Key Support & Resistance Strikes |
|---|
|
SPX Levels: [4400, 4300, 4200, 4000] |
|
SPY Levels: [430, 425, 420, 415] |
|
NDX Levels: [15500, 15000, 14600, 14000] |
|
QQQ Levels: [360, 357, 355, 350] |
|
SPX Combos: [(4424,81.67), (4399,92.92), (4373,79.10), (4348,86.06), (4327,82.48), (4310,86.79), (4301,93.21), (4293,80.33), (4289,74.70), (4280,83.88), (4276,82.47), (4263,84.43), (4242,78.83), (4212,81.82), (4200,98.29), (4191,75.86), (4162,86.93), (4149,95.46), (4140,74.12), (4132,76.88), (4123,89.29), (4111,87.87), (4098,98.03), (4077,77.22), (4060,79.35), (4056,81.49), (4051,95.62)] |
|
SPY Combos: [413.4, 403.26, 423.12, 408.33] |
|
NDX Combos: [14605, 14165, 14385, 13959] |
|
QQQ Combos: [361.73, 351.02, 356.38, 346.02] |