Macro Theme:
Short Term SPX Resistance: 5,150
Short Term SPX Support: 5,100
SPX Risk Pivot Level: 5,100
Major SPX Range High/Resistance: 5,200 SPX Call Wall
Major SPX Range Low/Support: 4,800
‣ 5,200 is the upside target.*
‣ 5,100 is critical support, up from 5,000 the week ending 3/1.*
‣ We look for index volatility to now contract (ref: 2/23, 1-month realized vol 14%, VIX 14.2).
‣ The week of 3/11 is the next major inflection point: 3/12 CPI & March Quarterly OPEX (3/15), followed by 3/20 VIX exp *
*updated 3/4
Founder’s Note:
ES futures are +20 bps to 5,120. NQ futures are +40 bps at 18,115.
Key SG levels for the SPX are:
- Support: 5,100, 5,069, 5,050, 5,040
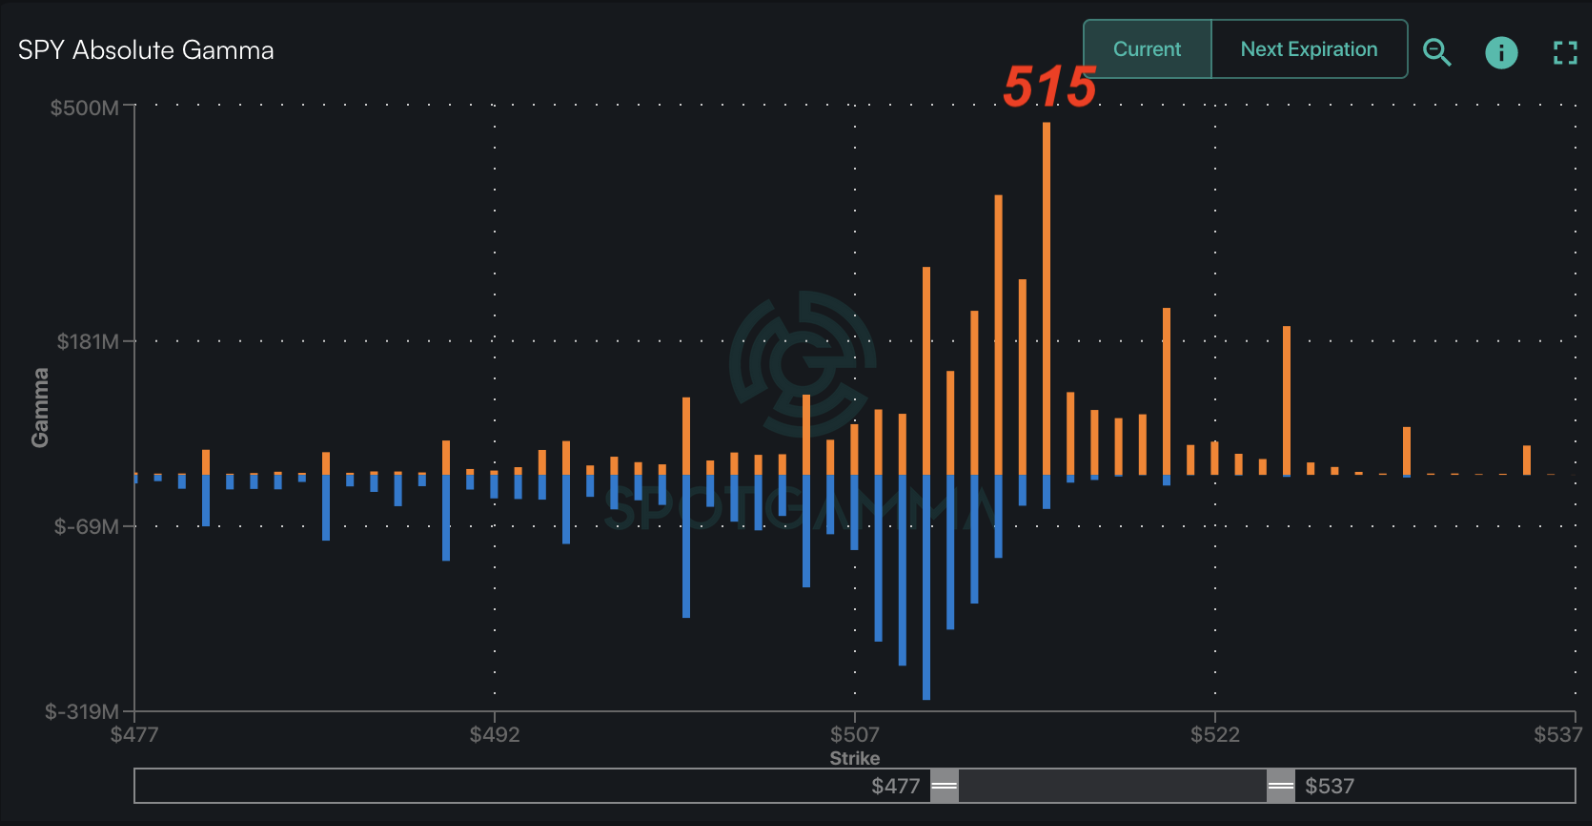
- Resistance: 5,115 (SPY 510), 5,125, 5,150, 5,160 (SPY 515
Call Wall
)
- 1 Day Implied Range: 0.54%
For QQQ:
- Support: 437
- Resistance: 440, 444
IWM:
- Support: 200, 195
- Resistance: 210
Call Wall
Data today: Continuing Claims at 8:30 AM ET, Powell with Congress 10 AM, Treasury Auction & Fed Mester at 11:30 AM.
Tuesday’s wide, whipping ranges gave way to relative calm yesterday, and futures are quiet this morning. We saw a lot of positions added to near-the-money strikes, with a chunky +20k open interest added to SPX 5,100 puts, and +75k in calls added (in total) to the 5,100-5,150 range. Add to this another +100k SPY puts in the 505-510 area, and +100k calls added to the 510-515 range. These are pretty sizeable positions to be added in a single day, with the 5,100 put strike being primarily sold, and a blend of long & short call positions above. With IV’s being so tight, the only ultra short dated options (where all the volume is) with any value are those within a ~1% range. With that, this new OI reinforces the stickiness of the 5,100 – 5,150 upside range, an we can see that reflected in the rather tight 54bps SG 1-day implied move.
In yesterday’s note we spend a lot of time on the 0DTE straddle also rather tight at ~55bps, and the SPX only mildly stretched those bounds yesterday with a session high low price range of 66bps. What also curious, and we’ve anecdotally seen this a few times, was that we quoted the 5,100 strike 0DTE straddle in our AM note, at around 7AM ET. The high of the day was ~5,125 which is right at 55bps.
Today’s SPX 0DTE straddle is an even tighter 50bps (ref 5,115), but we also have a large contraction in our 1 day move, to 54bps, as noted above. A 50bps range lines up into heavy 5,150 resistance above, and support at 5,100 (our range for today).
50bps straddles, in our view, are too tight and are a sign that we are due for a volatility pop. Even if you may not agree with that view, it seems harder to argue that there is very little risk/reward in selling a 50 bps straddle…That doesn’t mean you necessarily want to buy it either! The fact is that while the market isn’t concerned with Powell speaking today, nor Continuing claims, they do present some chance for volatility to percolate.
Regardless of our views, the takeaway is that the market does not seem to be concerned with volatility today, nor Monday (highlighted in red, below). There is a bit higher of an IV tied to tomorrow due to 8:30AM Non Farms, and dates >=next weeks CPI (3/12). CPI then flows right into 3/15 OPEX, followed by 3/20 (and the NVDA conference on 3/19). This time frame continues to be when we think that volatility should increase (for more than 1 day), and markets will pull away from the 5,100-5,150 range.
That being said, we still hold 5,100 as our risk-off level, as volatility is still likely to pop if that strike is broken.

Outside of the index flow, traders rushed in to buy the small dips in all of the hottest names. You can see this via the fresh all-time highs in SMH (semiconductor ETF). Even though this dip was bought, there was not a ton of follow through, with most of the gains being made premarket.

There is a famous axiom in trading that “topping is a process”. While we are unsure if this is a short term top, we are entering a window for potential contraction due to the upcoming expiration. Whats interesting about this on the data side, is that we are seeing the universally bullish skew rankings due off. This skew metric (y axis) measures the price of calls relative to puts, and then places that in a percentile. A high Skew Rank informs us that there is a lot of bullishness vs the last year, and this is what we saw in recent weeks. That had generated bright red “blobs” in the top left of this chart. IV Rank (x axis) measures 1 month IV of stocks, with more volatility pushing data points to the right of this chart. IV’s were higher into earnings, but now with earnings behind us, IV (and IV rank) had come in.
How we are seeing the concentration of stocks shift lower, and disperse. This infers a lower skew ranking (i.e. calls losing value relative to puts), and IV increase. With this happening into higher stock prices, it gives the appearance of traders starting to back off of calls, which is what you might see if the upside was indeed exhausted. We’ll be watching this closely into next week.

|
SpotGamma Proprietary Levels |
SPX |
SPY |
NDX |
QQQ |
RUT |
IWM |
|---|---|---|---|---|---|---|
|
Reference Price: |
$5104 |
$509 |
$18017 |
$438 |
$2068 |
$205 |
|
SpotGamma Implied 1-Day Move: |
0.54% |
0.54% |
|
|
|
|
|
SpotGamma Implied 5-Day Move: |
2.02% |
|
|
|
|
|
|
SpotGamma Volatility Trigger™: |
$5095 |
$511 |
$17690 |
$437 |
$2015 |
$204 |
|
Absolute Gamma Strike: |
$5000 |
$510 |
$17750 |
$440 |
$2050 |
$200 |
|
SpotGamma Call Wall: |
$5200 |
$515 |
$17750 |
$444 |
$2050 |
$210 |
|
SpotGamma Put Wall: |
$4800 |
$500 |
$17500 |
$415 |
$1950 |
$195 |
|
Additional Key Levels |
SPX |
SPY |
NDX |
QQQ |
RUT |
IWM |
|---|---|---|---|---|---|---|
|
Zero Gamma Level: |
$5075 |
$508 |
$17308 |
$438 |
$2047 |
$203 |
|
Gamma Tilt: |
1.196 |
0.881 |
1.446 |
0.973 |
1.03 |
1.114 |
|
SpotGamma Gamma Index™: |
1.34 |
-0.135 |
0.072 |
-0.013 |
0.003 |
0.019 |
|
Gamma Notional (MM): |
$379.497M |
‑$396.318M |
$7.898M |
$4.219M |
$2.759M |
$232.902M |
|
25 Delta Risk Reversal: |
-0.024 |
-0.022 |
-0.027 |
-0.027 |
-0.005 |
-0.007 |
|
Call Volume: |
531.964K |
2.173M |
12.287K |
956.547K |
15.929K |
378.378K |
|
Put Volume: |
876.162K |
2.79M |
11.584K |
1.27M |
29.975K |
445.239K |
|
Call Open Interest: |
7.248M |
6.58M |
56.105K |
4.461M |
281.449K |
4.706M |
|
Put Open Interest: |
14.311M |
16.428M |
73.373K |
8.443M |
506.685K |
8.437M |
|
Key Support & Resistance Strikes |
|---|
|
SPX Levels: [5000, 5100, 5050, 5200] |
|
SPY Levels: [510, 515, 500, 509] |
|
NDX Levels: [17750, 18000, 17600, 17625] |
|
QQQ Levels: [440, 435, 439, 434] |
|
SPX Combos: [(5350,85.67), (5299,97.55), (5273,78.61), (5258,84.37), (5248,97.01), (5237,77.74), (5227,92.83), (5212,75.33), (5207,84.58), (5202,99.73), (5197,81.50), (5192,73.74), (5186,80.23), (5181,82.11), (5176,97.44), (5171,90.53), (5166,85.96), (5161,83.73), (5156,94.43), (5151,99.00), (5146,84.83), (5140,83.24), (5135,83.48), (5130,87.12), (5125,91.55), (5100,97.40), (5089,88.71), (5084,71.50), (5069,90.30), (5059,78.97), (5038,86.28), (5013,90.37), (5008,86.64), (4977,75.83), (4957,79.60), (4952,81.65), (4901,88.16), (4875,73.86)] |
|
SPY Combos: [521.35, 516.26, 511.17, 531.53] |
|
NDX Combos: [17747, 17459, 18234, 18486] |
|
QQQ Combos: [434.65, 427.21, 432.03, 417.13] |
SPX Gamma Model
Strike: $5,811
- Next Expiration: $343,193,083
- Current: $343,226,324
View All Indices Charts
©2024 TenTen Capital LLC DBA SpotGamma