loader image

Informe Option Levels

Abr 11, 2024 | Option Levels

Short Term SPX Resistance: 5,200

Short Term SPX Support: 5,100

SPX Risk Pivot Level: 5,200

Major SPX Range High/Resistance: 5,300

Major SPX Range Low/Support: 5,000

‣ Market focus is on 4/10 CPI & 4/11 PPI. IV is relatively high into these events, which makes vanna a key flow later this week. As such we anticipate a large equity move <=5,100, or up into 5,300.*

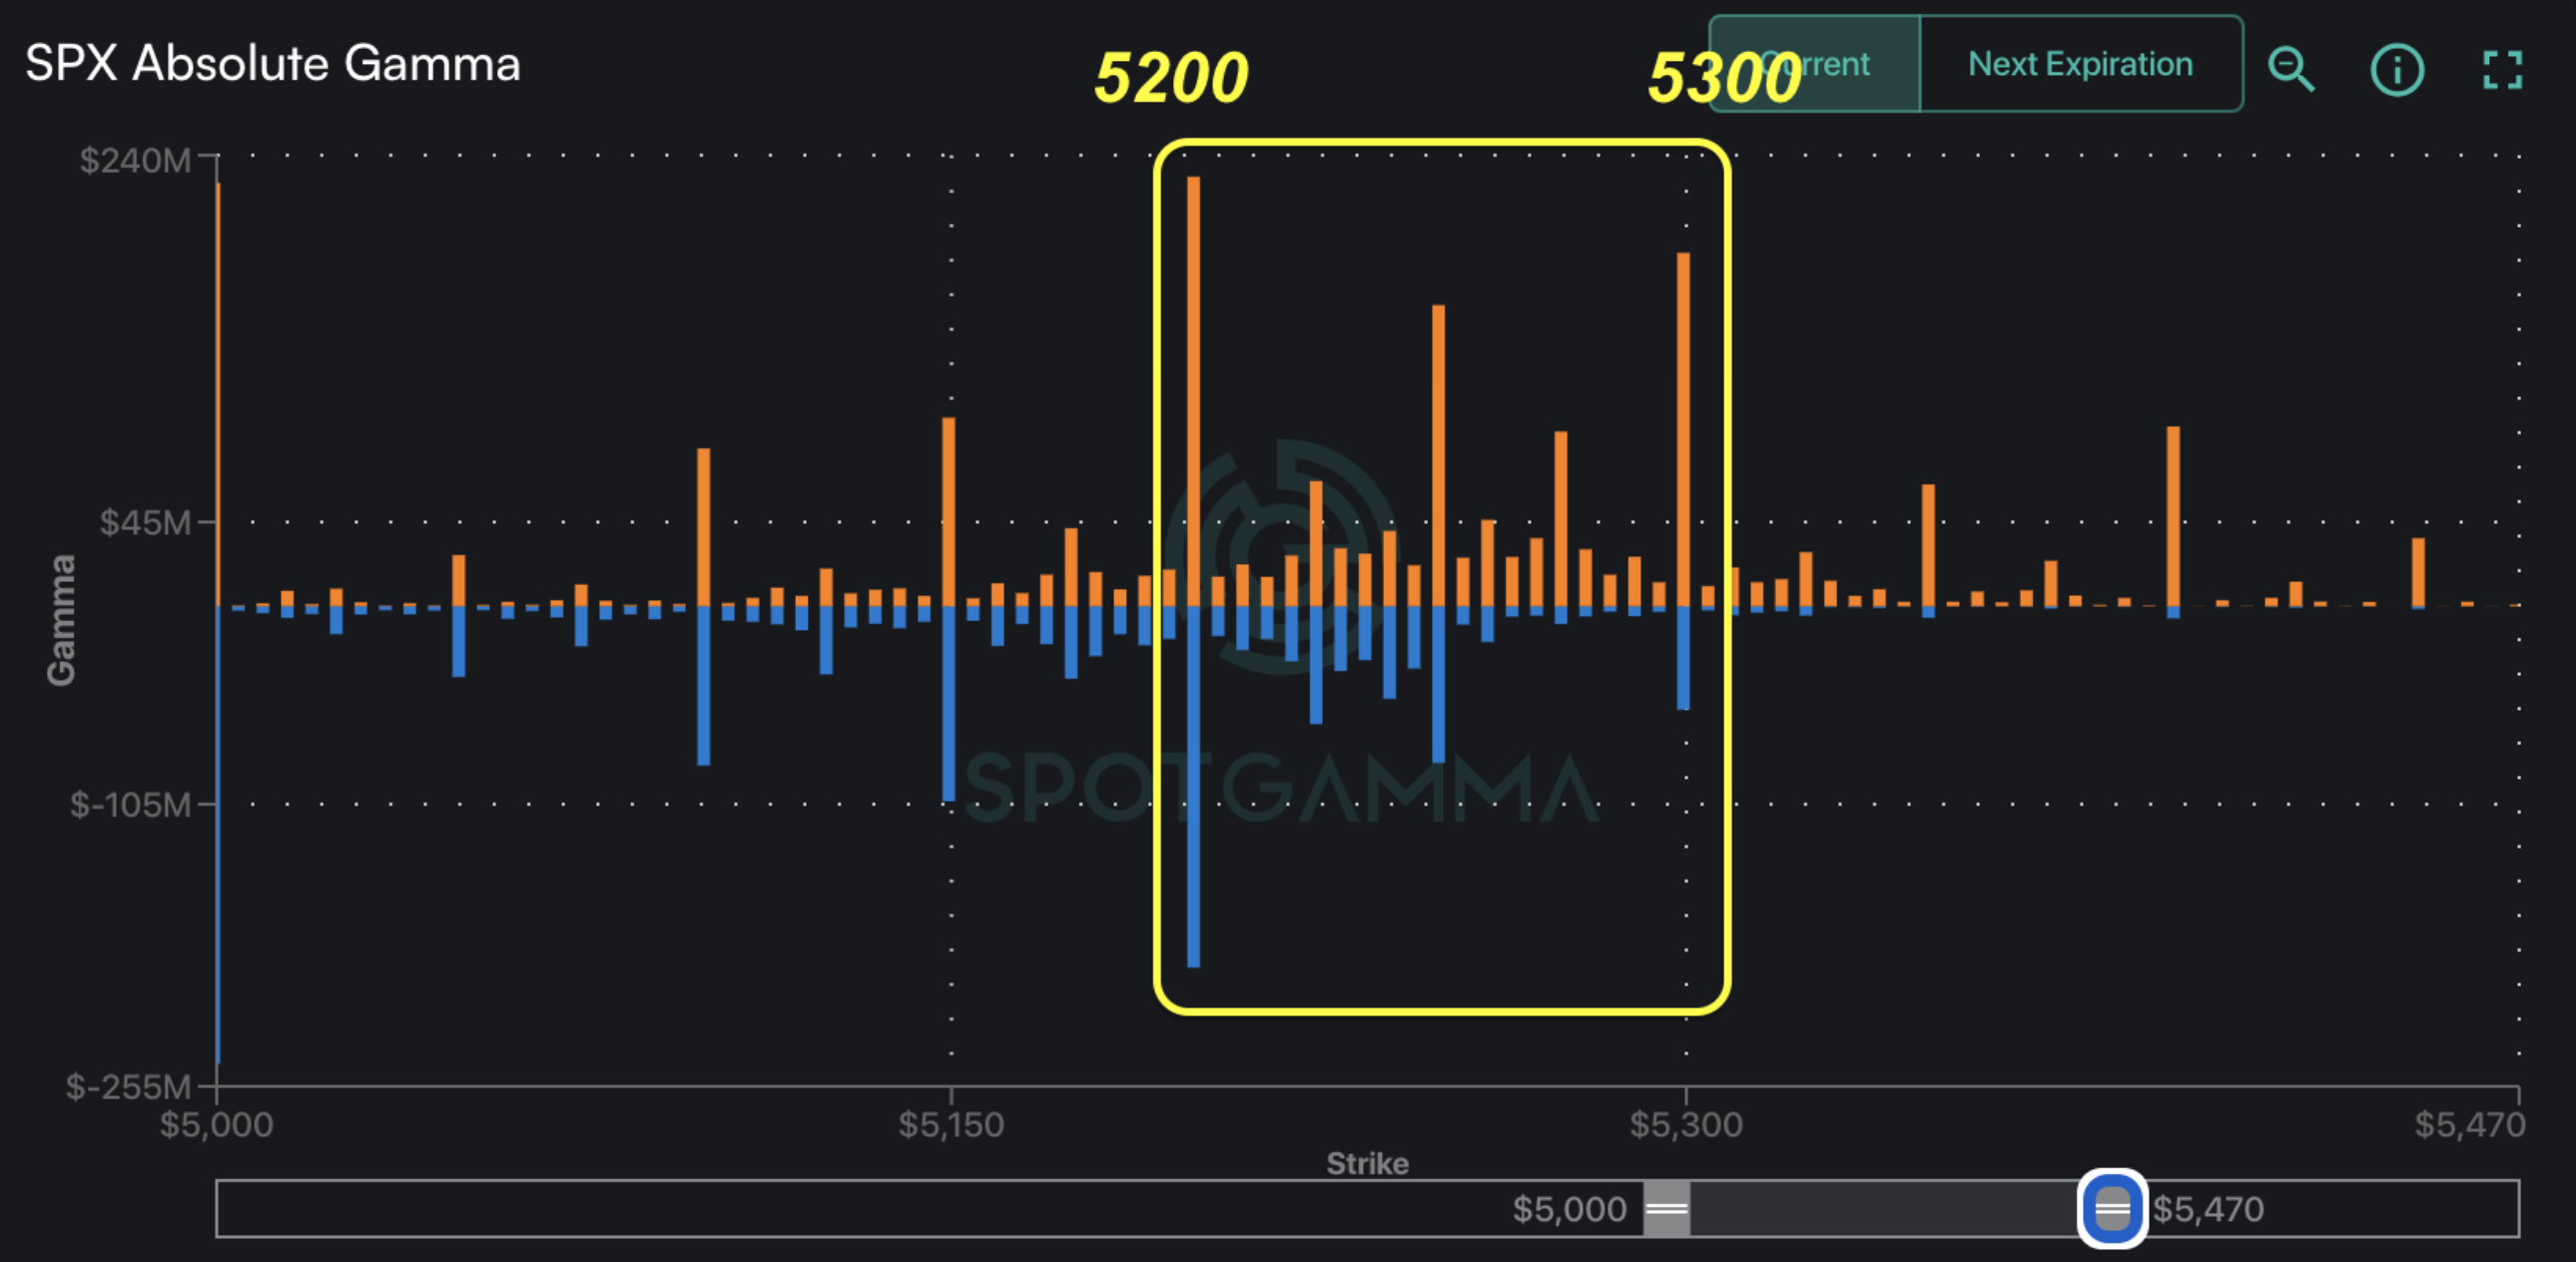
‣ 5,200 is critical support, up from 5,100 on 3/20. Below 5,200 is our risk off indicator.*

‣ 5,300 is our max target into April OPEX.*

*updated 4/8
**updated 3/19


Founder’s Note:

Both ES -30bps lower, to 5,190. NQ futures -90bps lower to 18,010.

Key SG levels for the SPX are:

  • Support: 5,125, 5100, 5,088
  • Resistance: 5,150, 5,200, 5,220
  • 1 Day Implied Range: 0.61%

For QQQ:

  • Support: 435, 430
  • Resistance: 440, 445

IWM:

  • Support: 198, 195
  • Resistance: 200, 205

PPI print is at 8:30AM ET, 8 & 4 week TBill auction at 11:30AM, 30Y TNote auction at 1pm.

Equities plunged early yesterday after the hot CPI, with SPX dropping to 5,150, then held tight, with an intraday trading range of just 75bps.

We’re always on the lookout for volatility across assets, as volatility from another products can easily jump into equities. To that point, rates are on the move, with the 10y jumping 20bps to +4.5%. The 5Y note saw its second biggest move in 10 years, only bested by a change during the covid crash (h/t @aRishiSays). These are some very big rate moves that are, so far, being very well absorbed by equities. And, these are treasuries, which are typically seen to be sound, stable assets. Further, we’d note analysts flagging yesterday’s 10Y auction as “bad”, with a 3.1bps tail. On this point, there is a 30Y auction, today at 1pm.

The rate jump has lifted the MOVE index, which measures Treasury bond volatility. Since 2022, there has been a pretty strong correlation between the VIX (orange) & MOVE index (candles), as shown below. Generally you can see that the VIX responds in kind with the MOVE when rate vol increases, but seems to reverse in advance of the MOVE index. Today’s PPI will likely add to the rate volatility, as will the 30Y auction.

For several weeks now, we’ve been flagging a move <5,200 as risk-off, with the implication that volatility was at risk of jumping, with dealer hedging flows possibly pushing equities lower (i.e. loss of positive gamma). While we think using 5,200 as the risk-off level has served well, equities have not responded with a sharp directional move lower. Instead, we see equities catching a bid off of volatility spasms. On this point we’d flag that our SG 1-Day implied move, which measures open/close ranges, has not broken >70bps over the past week.

You can see this dip-response with the levels chart we posted yesterday. There are big buy-the-dip responses to last Thursday’s drop, and another buy-the-dip on Tuesday, and some more, yesterday. These buying responses do however seem to be less effective, like support is being worn away.

Consider yesterday’s S&P500

HIRO

flow, which reflected that 0DTE (teal) again showed up buying deltas into yesterday’s close, in pretty strong size, too (~$2bn notional). This, we believe, served to buoy stocks as it did on other drawdows from the past week. While this “worked” yesterday, we’ve again seen signals its not working as well (see Friday’s note). We also posit that if vega (i.e. longer dated put/vol buying) comes in demand, 0DTE flows could be run over.

On that vega idea, there is another side to recent flows in the utter lack of longer dated put buying. Note the purple line, which measures longer dated options flow (>0DTE), and its lowest level on the day of ~ -$400mm. This is a relative pittance compared to the lowest reading we’ve seen in the last 30 days of -$6bn. This suggests a serious lack of demand for downside hedges.

This lack of vol is reflected in the VIX, which failed to even make 1 week highs (recall back to the top of our note & that treasury volatility).

You can further see the lack of vol response in the Fixed Strike Matrix, wherein we compare the change in vol across the surface from Monday’s close, to this AM. There is a very slight shade of green across the grid, showing that IV’s have barely lifted despite the SPX being ~1% lower from Monday’s close of 5,210. If equity traders were getting nervous about higher rates, they are not taking action in buying put/vol protection. If they were we’d see brighter shades of green at downside strikes.

Again, it seems rates traders are on alert.

This leads us around to a final point. We read sentiment here as bulls being emboldened by the fact that equities, while lower, have not flushed. This is a reasonable narrative, and some have even taken to calling our stance on <5,200 as “risk-off” incorrect because equities have not responded with a more material, directional move lower.

While equities could potentially catch a bid off of these market lows, we must maintain our stance of extreme caution here, as in our view the risks only seem to be increasing, and it certainly seems like things are less stable.

This was our quote from Thursday AM (before the big 2% intraday drop):

What has struck us most about flow this week, is that it has been completely dominated by 0DTE flow. This can be seen by the 0DTE

HIRO

line (teal) being tightly correlated to the All Exp flow (purple). Therefore we posit that market reactions seen this week are driven by those with very short term views/flows, and these flows have been essentially feeding mean reversion into the 5,200. Longer dated call buyers nor longer dated put buyers have decided to take much action despite a bit of equity weakness. The importance of this is that 0DTE flows are “here today, gone tomorrow”, which means we should not extrapolate longer term views (even a few days out) based on recent market movement. Risk remains high.

As we showed above, 0DTE is still a dominant flow, and the risk here is that at some point vol buyers wake up, and equities are served with another liquidity hole (i.e. we plunge violently, like Thursday). Since 2022 equities have moved inversely to rates, and this led to the destruction of bonds as an effective hedge against equities (i.e. 60/40 portfolios). This means that if/when higher rates matter to equities, the only choices may be: 1) sell your stock or 2) buy vol.

We do not want to be sitting here pitching some end-of-days scenario, but rather some type of correction wherein volatility pops in a way it has not done so in months (see here).


SpotGamma Proprietary Levels

SPX

SPY

NDX

QQQ

RUT

IWM

Reference Price:

$5160

$514

$18011

$438

$2028

$200

SpotGamma Implied 1-Day Move:

0.62%

0.62%

SpotGamma Implied 5-Day Move:

1.95%

SpotGamma Volatility Trigger™:

$5175

$515

$17890

$440

$2090

$204

Absolute Gamma Strike:

$5000

$500

$17900

$440

$2050

$200

SpotGamma Call Wall:

$5300

$530

$17900

$450

$2200

$210

SpotGamma Put Wall:

$5100

$500

$17500

$435

$1980

$198

Additional Key Levels

SPX

SPY

NDX

QQQ

RUT

IWM

Zero Gamma Level:

$5169

$517

$17831

$441

$2069

$207

Gamma Tilt:

0.869

0.647

1.146

0.694

0.577

0.504

SpotGamma Gamma Index™:

-1.023

-0.473

0.037

-0.156

-0.066

-0.123

Gamma Notional (MM):

‑$395.517M

‑$1.596B

$3.468M

‑$605.99M

‑$55.48M

‑$978.401M

25 Delta Risk Reversal:

-0.035

-0.008

-0.038

-0.011

-0.031

-0.006

Call Volume:

591.694K

2.241M

7.976K

924.814K

80.74K

579.634K

Put Volume:

932.936K

3.067M

9.494K

1.24M

166.842K

1.459M

Call Open Interest:

6.97M

6.842M

55.802K

3.827M

312.429K

4.353M

Put Open Interest:

14.016M

15.83M

82.136K

6.885M

574.597K

8.02M

Key Support & Resistance Strikes

SPX Levels: [5000, 5200, 5150, 5300]

SPY Levels: [500, 510, 520, 515]

NDX Levels: [17900, 18000, 18500, 18100]

QQQ Levels: [440, 435, 430, 420]

SPX Combos: [(5398,97.33), (5377,71.55), (5352,95.41), (5326,83.06), (5321,84.87), (5300,97.99), (5290,75.64), (5279,78.41), (5274,89.39), (5269,85.14), (5259,75.70), (5248,94.63), (5238,78.96), (5228,70.96), (5223,77.18), (5217,72.27), (5202,93.53), (5176,81.31), (5166,71.34), (5150,91.47), (5140,83.85), (5130,80.29), (5125,93.77), (5119,95.94), (5109,80.67), (5104,86.64), (5099,97.94), (5088,91.11), (5078,80.13), (5073,89.28), (5068,89.95), (5057,83.00), (5052,93.86), (5026,86.98), (5021,94.31), (5001,96.34), (4975,90.32), (4970,73.76), (4949,90.90), (4923,71.43), (4918,71.62)]

SPY Combos: [522.9, 532.67, 528.04, 518.27]

NDX Combos: [17904, 17868, 17669, 17255]

QQQ Combos: [431.71, 431.27, 426.01, 446.17]

SPX Gamma Model

$4,155$4,705$5,255$6,193Strike-$1.7B-$981M-$231M$1.2BGamma NotionalPut Wall: 5100Call Wall: 5300Abs Gamma: 5000Vol Trigger: 5175Last Price: 5160

View All Indices Charts