
Macro Theme:
Short Term SPX Resistance: 5,020 (SPY 500)
Short Term SPX Support: 4,980
SPX Risk Pivot Level: 5,020
Major SPX Range High/Resistance: 5,100
Major SPX Range Low/Support: 4,800
‣ If SPX closes >5,020 (SPY 500), we give edge toward a broader move to 5,100*
‣ <5,000 we shift back to “risk-off”, and would be on watch for a more significant volatility event, with next support at 4,800*
‣ May 1st FOMC is the critical date ahead
*updated 4/22
Founder’s Note:
ES +50bps to 5,028. NQ futures +50bps to 17,269.
Key SG levels for the SPX are:
- Support: 4,977, 4,950, 4,900
- Resistance: 5,000, 5,027, 5,050, 5,100
- 1 Day Implied Range: 0.57%
For QQQ:
- Support: 410
- Resistance: 420, 425
IWM:
- Support: 190
- Resistance: 195, 200, 205
3 & 6 month TBill auction today at 11:30AM ET
From a gamma strike perspective, SPX5,000/SPY500(SPX 5,020) strike range remains the largest gamma zone, and that appears to be pulling equities back in this morning. Should the SPX close >5,020 (SPY 500), we would be bullish to 5,100. A close <5,000 keeps the door open for a major jump in realized volatility, as discussed in depth on Friday.

From a vol perspective, SPX implieds remain flat despite equities sliding lower. Below is SPX term structure, with IV’s near 16%, and that is essentially flat out in time. The key date that traders will begin focusing on is 5/1 FOMC. Generally you would see a sharply backwardated term structure during times of heavy market stress, and so we find this current structure a bit unusual.

Looking at skew, we actually see 1-month SPX RV a bit lower on a skew basis, with SPX skew by delta shown from 4/17 (gray) to this morning (teal). Again, considering the SPX is ~1.75% lower from 4/17, and -5% from 4/1, one would expect more of a material difference.

The oddity in this market is that we are just not “realizing” any significant S&P500 moves, with short dated realized vol measures hovering just above 10%. However, the selling pressure is quite persistent, as Friday marked the 5th consecutive down day, which ties for the second largest streak in the last 5 years – only 2nd to the 6-day Covid Crash in Feb ’20 (see Friday’s note).
Where things are getting spicy is in tech & the QQQ’s, with QQQ -7.5% this month. NVDA, which was the top stock of ’24, is -20% since highs in late March, with -15% of that coming in the last week. Further, as you can see below, its nearly closed the gap from its Feb earnings releases which coincides with the only +2% up day for SPX in the last +400 days. You may recall from this presentation that that streak of 412 days without a +2% up day was the 4th longest in 20 years.
Meanwhile, we are still without a <-2% down day in the SPX, the 3rd longest streak in 20 years.

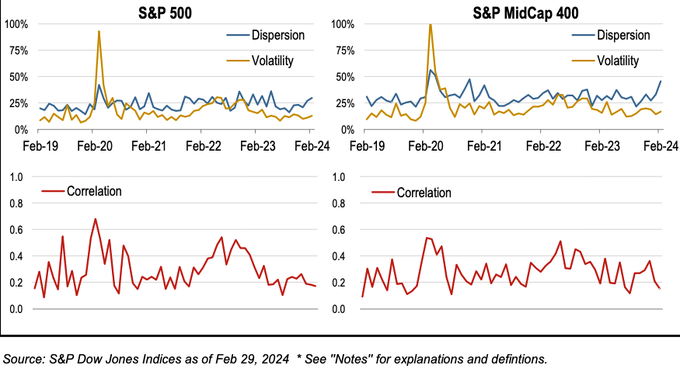
In early March we presented this view of correlation & dispersion, which highlighted how these metrics flagged a bubble in single stocks. Flagging the overstretched relative performance of specific sectors, like chips, was not difficult. However, understanding when things would normalize was unknown, because a trigger was needed.
The image below is from that early March presentation, with the high dispersion (blue) and relative low vol (yellow) signaling the poor breadth/”bubble like” behavior into early March. Further, correlation (red), was also extremely low, which signaled that not all stocks were enjoying ’24’s huge rally.
Its clear at this stage that this bubble has largely unwound/deflated as leading sectors have mean reverted. If you think back to this incredible streak of low SPX Index volatility that we were in (i.e. 3rd longest streak without a -2% move, and 4th largest without +2%), then it ties back into this “dispersion/correlation” unwind idea. SPX index vol was stable on the way up, and its been stable on the way down, while stocks like NVDA that were “crashing up” are now “crashing down”.
The above speaks to reflexive flows unwinding, as opposed to something more “forced”. In a true risk off situation, we argue that you’d see index volatility jump higher. What is ironic in this case, is that certain measures of vol premium are extended, such as the measure below of the VIX vs 1-month SPX realized vol. The irony here is that the 18ish VIX is high relative to the 12ish realized volatility. VIX of 18 is

VIX of 18 is actually rather low compared to the last 4 years, as you can see below. Recall that a VIX of 16% equates to traders roughly pricing 1% daily SPX moves – historically this is a pretty low bar for volatility.
Therefore, our argument here has been, and continues to be, that what we’ve been seeing here is not a true “risk off” scenario as we have arguably not seen a full equity capitulation. We are seeing many signs of oversold (i.e 2nd largest streak of down days in last 5 years, and major gap between single stock puts & calls, here), but not what appears to be forced selling. For example if correlation snapped higher, and SPX skew rotated up, those are indications of traders being writ-large pushed out of equities (i.e. not just dumping tech or other various single names).
The risk of such an event remains much more material under 5,000, because we believe that larger systematic flows which are supporting index vol wear away <5,000, because <5,000 is where we see primarily put positions. We suspect that such a trigger is unlikely to happen before 5/1 FOMC, unless things materially escalate on the geopolitical front.

|
SpotGamma Proprietary Levels |
SPX |
SPY |
NDX |
QQQ |
RUT |
IWM |
|---|---|---|---|---|---|---|
|
Reference Price: |
$4967 |
$495 |
$17037 |
$414 |
$1947 |
$193 |
|
SpotGamma Implied 1-Day Move: |
0.60% |
0.60% |
|
|
|
|
|
SpotGamma Implied 5-Day Move: |
1.95% |
|
|
|
|
|
|
SpotGamma Volatility Trigger™: |
$5090 |
$511 |
$17220 |
$430 |
$2050 |
$202 |
|
Absolute Gamma Strike: |
$5000 |
$500 |
$17250 |
$420 |
$2050 |
$190 |
|
SpotGamma Call Wall: |
$5100 |
$520 |
$17250 |
$450 |
$2200 |
$220 |
|
SpotGamma Put Wall: |
$4900 |
$500 |
$16800 |
$410 |
$1900 |
$190 |
|
Additional Key Levels |
SPX |
SPY |
NDX |
QQQ |
RUT |
IWM |
|---|---|---|---|---|---|---|
|
Zero Gamma Level: |
$5089 |
$509 |
$17382 |
$429 |
$2032 |
$208 |
|
Gamma Tilt: |
0.621 |
0.464 |
0.640 |
0.491 |
0.483 |
0.360 |
|
SpotGamma Gamma Index™: |
-2.977 |
-0.614 |
-0.084 |
-0.208 |
-0.075 |
-0.143 |
|
Gamma Notional (MM): |
‑$1.068B |
‑$2.13B |
‑$8.464M |
‑$854.69M |
‑$69.748M |
‑$1.309B |
|
25 Delta Risk Reversal: |
-0.041 |
0.00 |
-0.027 |
-0.019 |
0.00 |
-0.013 |
|
Call Volume: |
775.066K |
2.374M |
22.349K |
1.507M |
45.74K |
332.738K |
|
Put Volume: |
1.386M |
2.798M |
14.755K |
1.782M |
76.852K |
1.027M |
|
Call Open Interest: |
6.899M |
6.512M |
57.26K |
3.847M |
308.187K |
3.685M |
|
Put Open Interest: |
13.245M |
12.691M |
74.747K |
5.938M |
536.645K |
7.686M |
|
Key Support & Resistance Strikes |
|---|
|
SPX Levels: [5000, 5100, 4900, 5200] |
|
SPY Levels: [500, 490, 495, 510] |
|
NDX Levels: [17250, 17500, 17000, 16800] |
|
QQQ Levels: [420, 415, 410, 425] |
|
SPX Combos: [(5201,83.79), (5101,91.08), (5052,84.88), (5027,92.81), (5017,88.79), (5002,95.56), (4977,97.26), (4972,73.85), (4967,87.39), (4962,79.13), (4957,74.51), (4952,97.22), (4947,73.91), (4942,79.60), (4937,86.52), (4932,71.04), (4923,94.33), (4918,94.59), (4908,80.86), (4898,99.13), (4888,79.41), (4878,75.80), (4873,95.97), (4863,85.97), (4858,74.44), (4848,97.76), (4823,93.40), (4813,78.46), (4798,98.21), (4774,78.31), (4749,91.51)] |
|
SPY Combos: [494.11, 491.63, 489.16, 484.21] |
|
NDX Combos: [16850, 17242, 17055, 16441] |
|
QQQ Combos: [411.33, 406.36, 416.31, 401.38] |