
Macro Theme:
Short Term SPX Resistance: 5,625 (SPY 560)
Short Term SPX Support: 5,550
SPX Risk Pivot Level: 5,550
Major SPX Range High/Resistance: 5,665 (SPY 565)
Major SPX Range Low/Support: 5,500
Positions changes for 7/17 VIX-exp and 7/19 OPEX open a window for volatility shifts, and a break from the extreme equity calm.
- Upside scenario:
- On 5/10 we marked 5,600 – 5,625 (SPY 560) is the target high into July OPEX. This is still a key zone into 7/12
- SPY 565 (SPX 5,665) shows as a major high into 7/19 OPEX
- Downside scenario:
- 5,500 is our major risk off level as of 7/12
Founder’s Note:
ES &NQ futures are flat at 5,640 and 20,440, respectively.
Key SG levels for the SPX are:
- Support: 5,562, 5550, 5500
- Resistance: 5,600, 5,624, 5,650
- 1 Day Implied Range: 0.65%
For QQQ:
- Support: 490
- Resistance: 500
IWM:
- Support: 210, 204, 200
- Resistance: 215
Just as quickly as things spooled higher on Wednesday, they unwound yesterday. Before we dive in, note the
Call Walls
have retracted back to where they were on Wednesday: SPX 5,600, QQQ, 500. The SPY Call Wall stands at 565. This re-establishes resistance in the key zone of 5,600-5,625 which is our anticipated high into this afternoon (see the “Macro Theme” at the top of our note). 5,562 (SPY 550) – SPX 5,550 is major support for today.
Today we favor a pinning type move back into the 5,600-5,625 zone, but we have big concerns for next week.
What happened yesterday, left many scratching their heads:

To us, and SG Members, it seems rather clear.
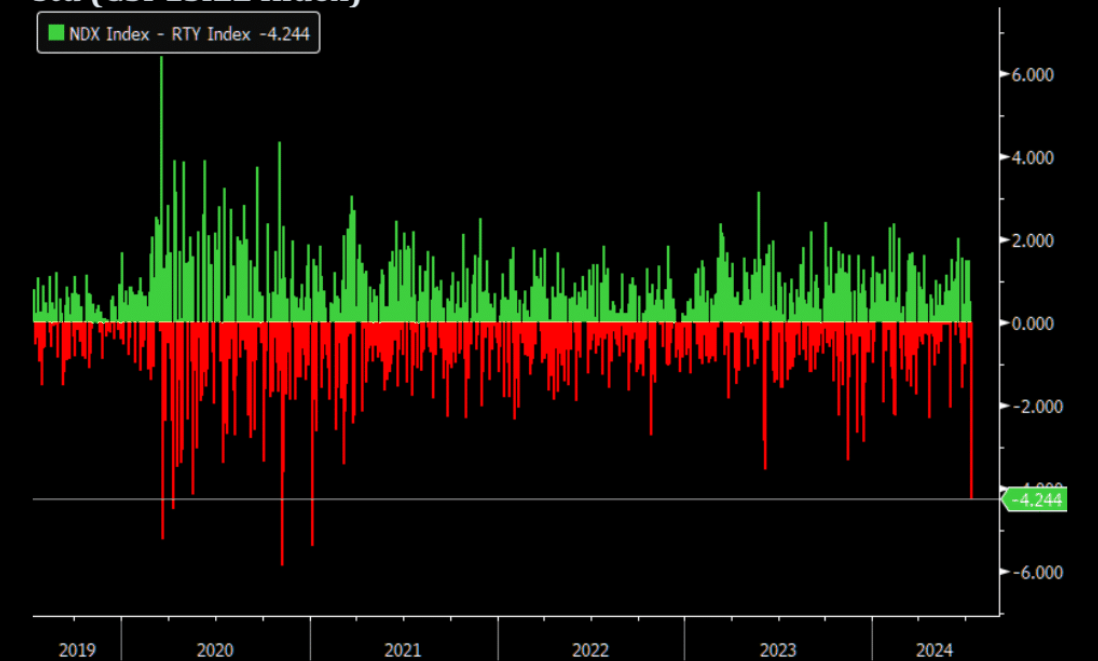
They key feature of yesterday’s equity movement was the biggest spread between small cap IWM vs Tech QQQ performance since Jan 6th, 2021 (h/t ZH), the the low CPI solidified a Fed rate cut. Odds of a Fed cut by September shot to 89% after the CPI.
This is an important note, as we believe if yesterday was a signal that equities were in a major top, all equities would be sold off. Instead what we saw was a rotation out of the “extremely outperforming” top tech names, and into the laggards. Does that mean equities are done correcting? Not exactly.
Recall our note yesterday about concentration risk. The top 3 stocks account for +20% of SPX & NDX weights, which means that when those names moved up sharply on Wednesday, they force the major indexes higher. Well, that works both ways. When NVDA/AAPL/MSFT all reverse violently, it forces the indexes down, too. So NVDA -5%, AAPL -2.5% and MSFT -2.5% alone means -70bps of index pressure.
A big part of yesterday’s single stock pressure was massive, longer dated (>next exp) call selling in tech. You can get a sense of this in the plot of combined single-stock
HIRO
flow in the S&P, below. This total figure of ~$5.8bn was near 1-month highs, and as you can see dominated by call selling (orange) vs put buying (blue). This delta selling pressure pushes those megacap stocks down, which in turn forces indexes lower. As options are leverage, this is leveraged selling pressure.
This is traders only so far “taking some chips off the table” vs betting on violent downside. Call selling is different from put buying in that, while they are both initially short delta trade, the call selling pressure wears off as a stock declines and calls go to zero. However, put values obviously increase as stocks go down, adding to dealer hedging pressure as stocks drop.

Both Wednesday & Thursday’s movement were a feature of the record low correlation (plotted below) and dispersion that we have been going on about since April, and flagged again on Monday. The narrow list of stocks that has so violently moved higher over the past year are unlikely to fall back in line without a “stock down, vol up” move. In other words, the record low correlation, in our view, won’t normalize without the megacaps & semis “catching down” to broader equities.
Further, correlation generally spikes when equities all decline, generally due to some macro risk. We also can’t help but wonder if there is going to be a final “yield chase” with rate cut odds surging. The takeaway here is that moves like yesterday have high odds until correlation normalizes.

Lets turn to our concerns for next week.
The S&P has benefitted from large positive gamma over the past several weeks, as seen in major lows in realized vol. The way that positive gamma is removed is through lower SPX prices (a grind-down which “wears off” positive gamma) and/or through the removal of positions – like with OPEX.
If you look below we have a massive level at 5,550, and a break below there likely invokes a test of 5,500. However, below 5,500 positions drop significantly, and they turn to predominantly puts (vs call-heavy near current prices). Further, into next week we are likely to lose about 1/3 of total S&P gamma. The takeaway here is that we are on watch for a test of 5,500 into next week, and if that level breaks we are back on high-alert.

|
| /ES | SPX | SPY | NDX | QQQ | RUT | IWM |
|---|---|---|---|---|---|---|---|
| Reference Price: | $5637.78 | $5584 | $556 | $20211 | $491 | $2125 | $210 |
| SG Gamma Index™: |
| 1.232 | -0.065 |
|
|
|
|
| SG Implied 1-Day Move: | 0.65% | 0.65% | 0.65% |
|
|
|
|
| SG Implied 5-Day Move: | 1.95% | 1.95% |
|
|
|
|
|
| SG Implied 1-Day Move High: | $5681.61 | $5627.83 | $561.25 |
|
|
|
|
| SG Implied 1-Day Move Low: | $5608.93 | $5555.15 | $554.01 |
|
|
|
|
| SG Volatility Trigger™: | $5613.78 | $5560 | $556 | $20290 | $493 | $2080 | $204 |
| Absolute Gamma Strike: | $5603.78 | $5550 | $557 | $20000 | $490 | $2100 | $210 |
| Call Wall: | $5653.78 | $5600 | $565 | $19750 | $500 | $2200 | $215 |
| Put Wall: | $5608.78 | $5555 | $545 | $20190 | $490 | $2000 | $200 |
| Zero Gamma Level: | $5605.78 | $5552 | $555 | $20160 | $491 | $2072 | $205 |
|
| SPX | SPY | NDX | QQQ | RUT | IWM |
|---|---|---|---|---|---|---|
| Gamma Tilt: | 1.174 | 0.937 | 0.968 | 0.834 | 1.546 | 1.446 |
| Gamma Notional (MM): | $377.482M | $16.907M | ‑$3.84M | ‑$332.642M | $43.50M | $775.974M |
| 25 Delta Risk Reversal: | -0.023 | 0.000 | -0.023 | 0.001 | -0.002 | 0.020 |
| Call Volume: | 608.99K | 1.921M | 19.297K | 1.391M | 62.135K | 1.767M |
| Put Volume: | 1.055M | 2.185M | 25.022K | 1.677M | 61.814K | 1.377M |
| Call Open Interest: | 6.695M | 5.056M | 61.93K | 3.442M | 307.121K | 4.477M |
| Put Open Interest: | 14.352M | 13.285M | 125.139K | 6.731M | 503.008K | 7.962M |
| Key Support & Resistance Strikes |
|---|
| SPX Levels: [5550, 5600, 5500, 5000] |
| SPY Levels: [557, 560, 555, 550] |
| NDX Levels: [20000, 19750, 19975, 20500] |
| QQQ Levels: [490, 495, 500, 492] |
| SPX Combos: [(5853,90.41), (5825,70.10), (5802,97.39), (5774,85.53), (5769,75.62), (5752,99.19), (5724,91.70), (5719,78.56), (5707,70.24), (5702,99.28), (5691,83.97), (5679,73.27), (5674,91.49), (5668,93.13), (5663,92.89), (5652,99.24), (5640,93.65), (5629,94.82), (5624,96.88), (5618,98.73), (5612,99.20), (5607,85.84), (5601,99.51), (5590,80.69), (5562,93.32), (5557,93.02), (5545,72.82), (5540,80.28), (5523,81.65), (5518,81.71), (5501,93.44), (5490,75.48), (5484,73.64), (5478,72.50), (5473,70.22), (5467,88.61), (5451,81.69), (5417,78.48), (5400,81.82), (5372,75.76), (5350,78.52), (5316,75.63)] |
| SPY Combos: [560.31, 563.1, 558.09, 568.1] |
| NDX Combos: [20131, 20535, 20211, 19746] |
| QQQ Combos: [493.88, 498.8, 488.96, 496.83] |
0 comentarios