Futures are at 4675, bouncing from overnight lows of 4657. Combining yesterdays options flows with the shift down in SPX price, we see a large reduction in gamma. Despite gamma now being flat to slightly negative our models looks for a max open/close move of 0.50% today, with support at 4650 then 4600. We see the 4673 to 4682 as “fair value” and then 4700 resistance.
Traders are focused on this mornings 8:30AM ET CPI report which may have implications for Wednesdays FOMC. As noted last night, we saw sharp drawdowns in many meme stocks like TSLA (-6%), AMC (-9%), ARKK (-5%). This suggests that volatility is increasing under the markets surface, despite the SPX only being down 50bps yesterday.
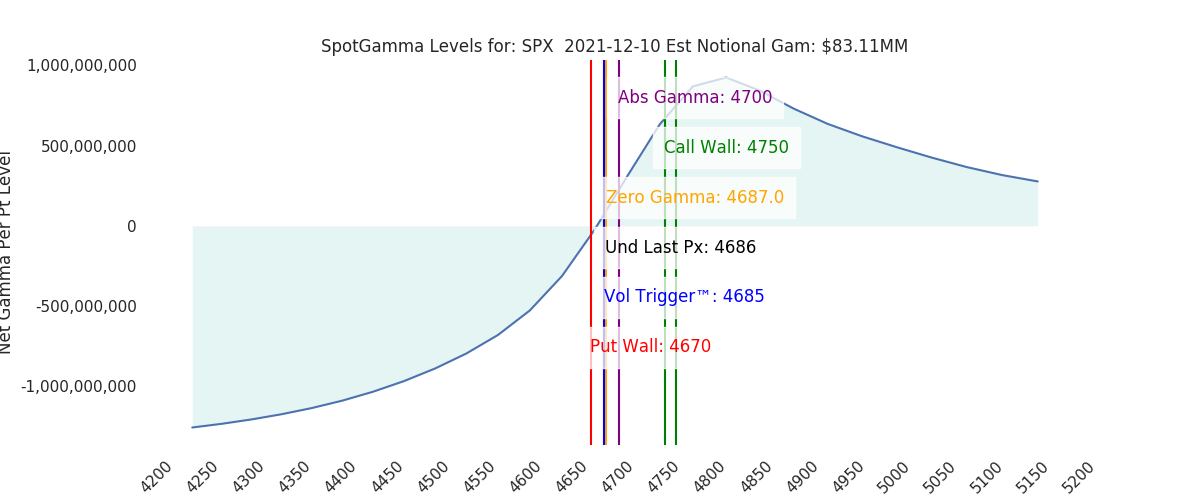
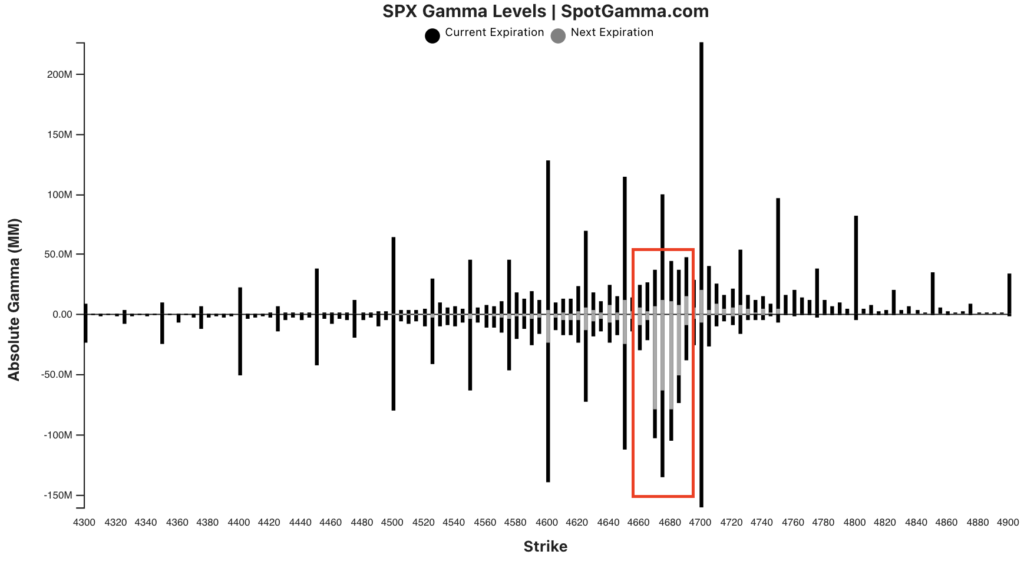
We also note our intraday signals saw short dated put positioning increase in the S&P500 which resulted, in the Vol Trigger (our gamma flip point) jumping 70 handles to 4685. In the chart below we’ve outlined this new area of large negative gamma bars, that suggests traders added puts for todays expiration. This flow turns today in a significant expiration (see “expiration” table here), which could have the effect of adding to volatility today. This is particularly true into the open as positions change around the CPI print. For this reason we think a break of 4650 could lead to a quick test of 4600.
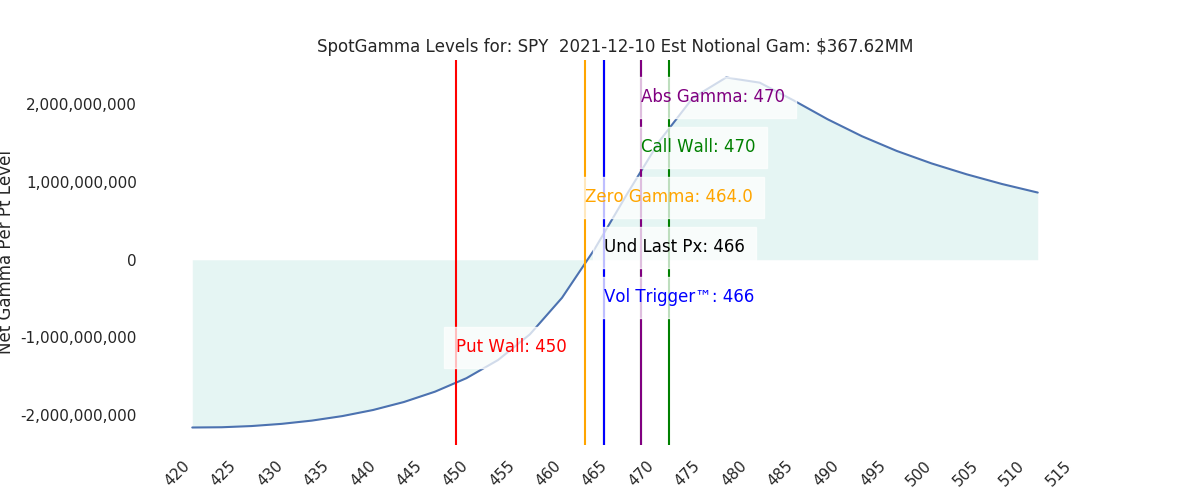
The bottom line is that we see fairly limited upside in todays market, due to the large gamma lines at 470SPY/4700SPX. We had been of the view that volatility would remain muted into the FOMC, but options positioning has changed. The downside is a worry here due to the single stock volatility that has returned, and the lack of positive gamma bars <=4650. A bad CPI print may lead to increased hedging demand, which could add to dealer shorting. Furthermore there cannot be a material selling of implied volatility until Post FOMC, indicating a lack of “bounce fuel” should markets break down the next several days. We still give edge to the market holding just under 4700, but be advised that the downside could be slippery.
Model Overview:
4600 gamma flip level, 4550 critical support. 4700 overhead target.
| SpotGamma Proprietary Levels | Latest Data | Previous | SPY | NDX | QQQ |
|---|---|---|---|---|---|
| Ref Price: | 4668 | 4668 | 466 | 16152 | 393 |
| SpotGamma Imp. 1 Day Move: | 0.5%, | Est 1 StdDev Open to Close Range (±pts): 23.0 | |||
| SpotGamma Imp. 5 Day Move: | 4.1% | 4559 (Monday Ref Px) | Range: 4373.0 | 4747.0 | ||
| SpotGamma Gamma Index™: | 0.07 | 1.44 | 0.07 | 0.04 | -0.05 |
| Volatility Trigger™: | 4685 | 4615 | 466 | 15920 | 395 |
| SpotGamma Absolute Gamma Strike: | 4700 | 4700 | 470 | 16575 | 400 |
| Gamma Notional(MM): | $-78 | $94 | $368 | $5 | $-210 |
| Additional Key Levels | Latest Data | Previous | SPY | NDX | QQQ |
|---|---|---|---|---|---|
| Zero Gamma Level: | 4660 | 4660 | 0 | 0 | 0 |
| Put Wall Support: | 4670 | 4400 | 450 | 16150 | 390 |
| Call Wall Strike: | 4750 | 4750 | 470 | 16575 | 400 |
| CP Gam Tilt: | 1.01 | 1.05 | 1.1 | 1.4 | 0.87 |
| Delta Neutral Px: | 4473 | ||||
| Net Delta(MM): | $1,972,043 | $1,948,256 | $218,231 | $44,740 | $111,270 |
| 25D Risk Reversal | -0.08 | -0.07 | -0.08 | -0.09 | -0.09 |
| Key Support & Resistance Strikes: |
|---|
| SPX: [4700, 4675, 4650, 4600] |
| SPY: [470, 468, 465, 460] |
| QQQ: [400, 398, 395, 390] |
| NDX:[16575, 16500, 16350, 16000] |
| SPX Combo: [4752.0, 4799.0, 4701.0, 4673.0, 4682.0] |
| SPY Combo: [474.74, 479.41, 469.61, 466.82, 467.75] |
| NDX Combo: [15704.0, 15911.0] |