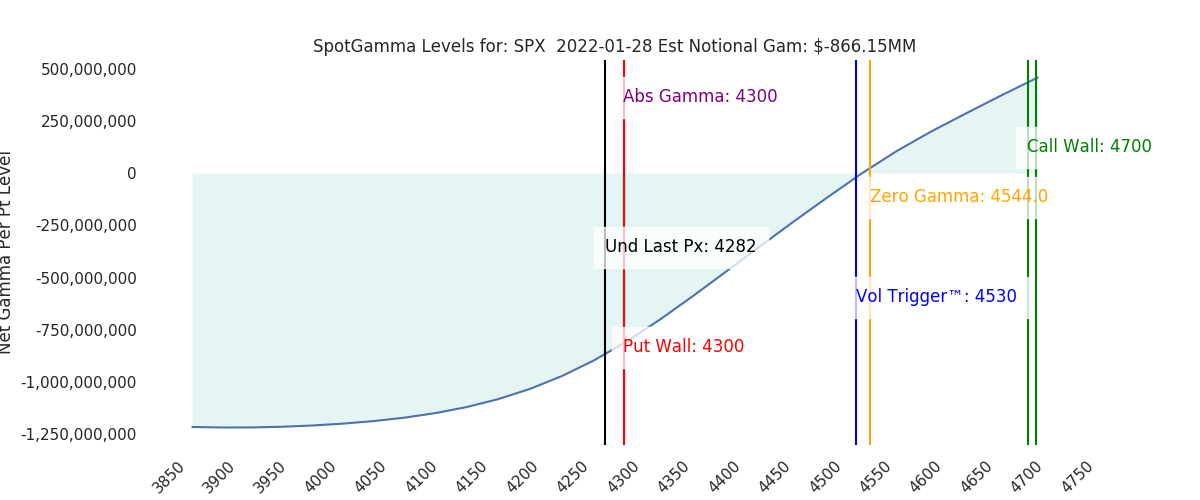
Futures have pushed lower to 4280, after overnight highs near 4350. We show little change in the options positioning, and therefore expect another day of high volatility. 4300 is the support line, with 4400 resistance.
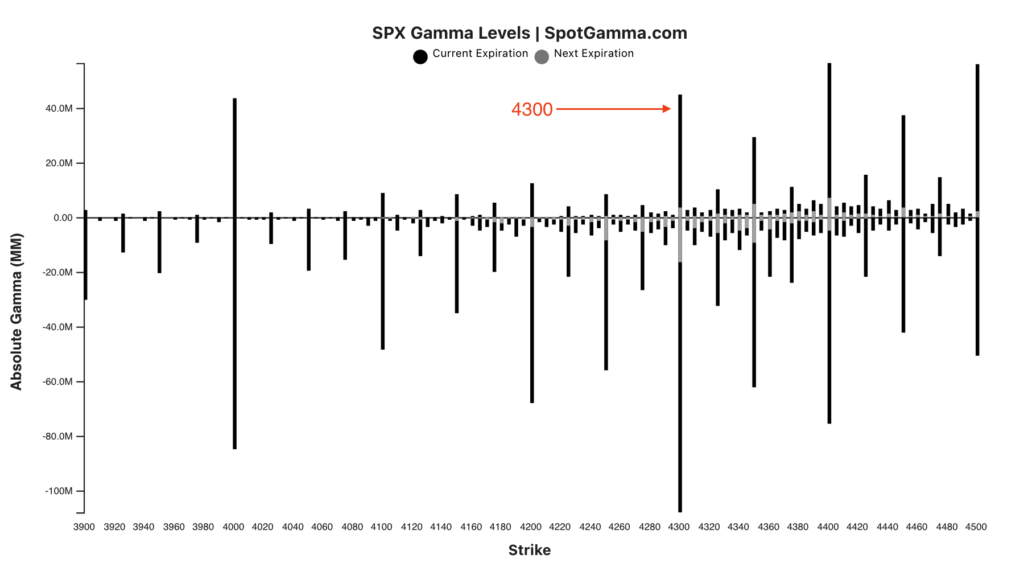
4300 is the Put Wall, which indicates that it is the strike with the largest amount of net negative gamma. In the figure below you can see that there is a bit of call gamma at 4300, too. However at strikes below there, call gamma is nonexistent down to the large 4000 strike.
As a result, should markets sell the options hedging will go along. Because of our “lower bound” concept, we don’t see the current options related flows expanding downside volatility significantly. However, a major spike higher in implied volatility[IV] would certainly be additive to dealer selling (via the vanna trade), as would the addition of new put options (it increases dealer short deltas).
One of the more concerning elements is that the market is unable to stage a material rally given the put-heavy options positioning. Our view has been that a dealer-driven short hedge cover rally could easily ignite a rip higher in markets – and that setup still exists.
However the flow we’ve seen shows that traders are keen to sell calls on tests of 4400, and there is little to no change in puts (or IV). Furthermore, we’d note that todays expiration does not hold material open interest (i.e. we don’t see a bid coming from expiring puts).
In summary…this is a tricky position. An options-linked hedge unwind could still push a violent rally, and options hedging to the downside is likely not a big influence (barring a major spike in IV or many new put buyers).
A break below 4300 signals that IV is increasing, which would add to selling pressures. On the contrary, rallies have proven to be unstable, and we’d continue to treat them as such until there is a close >4400.
We still give an edge to a rally, as markets just “doing nothing” will start to weigh on IV, which when combined with time decay create bullish tailwinds (via vanna & charm flows).
| SpotGamma Proprietary Levels | Latest Data | Previous | SPY | NDX | QQQ |
|---|---|---|---|---|---|
| Ref Price: | 4282 | 4346 | 426 | 13930 | 341 |
| SpotGamma Imp. 1 Day Move: | 1.43%, | Est 1 StdDev Open to Close Range (±pts): 61.0 | |||
| SpotGamma Imp. 5 Day Move: | 3.7% | 4384 (Monday Ref Px) | Range: 4223.0 | 4547.0 | ||
| SpotGamma Gamma Index™: | -1.59 | -1.43 | -0.32 | -0.01 | -0.14 |
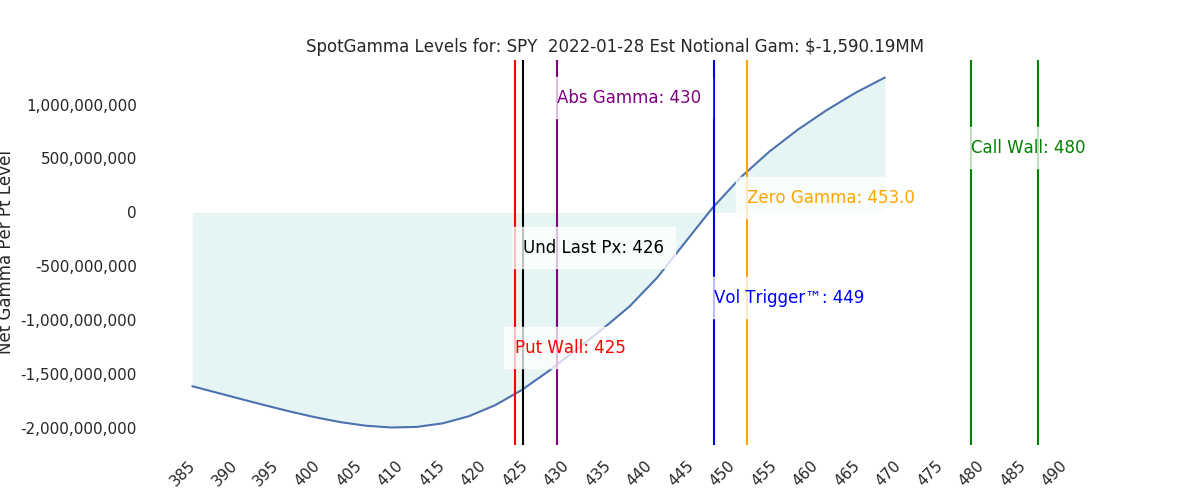
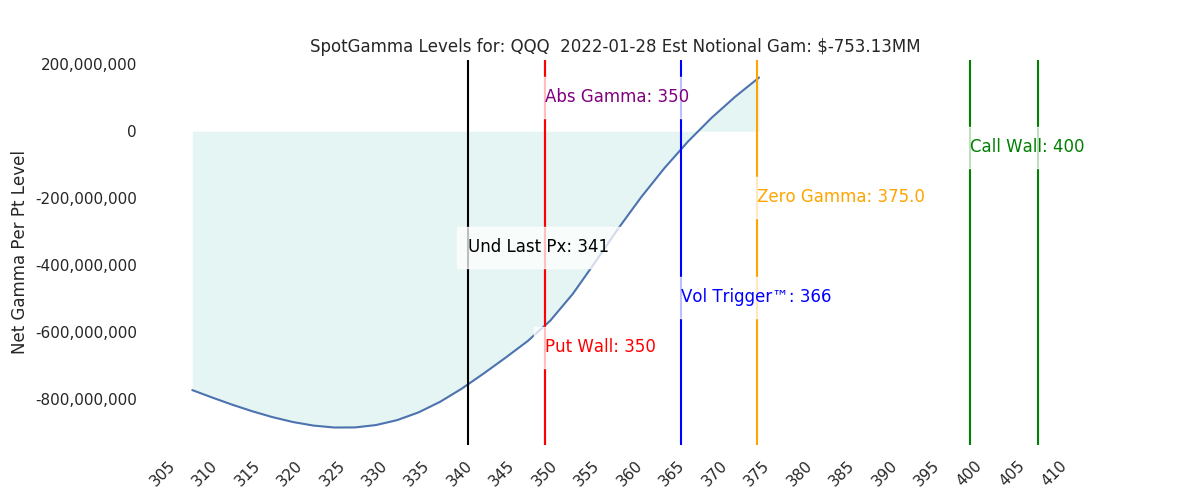
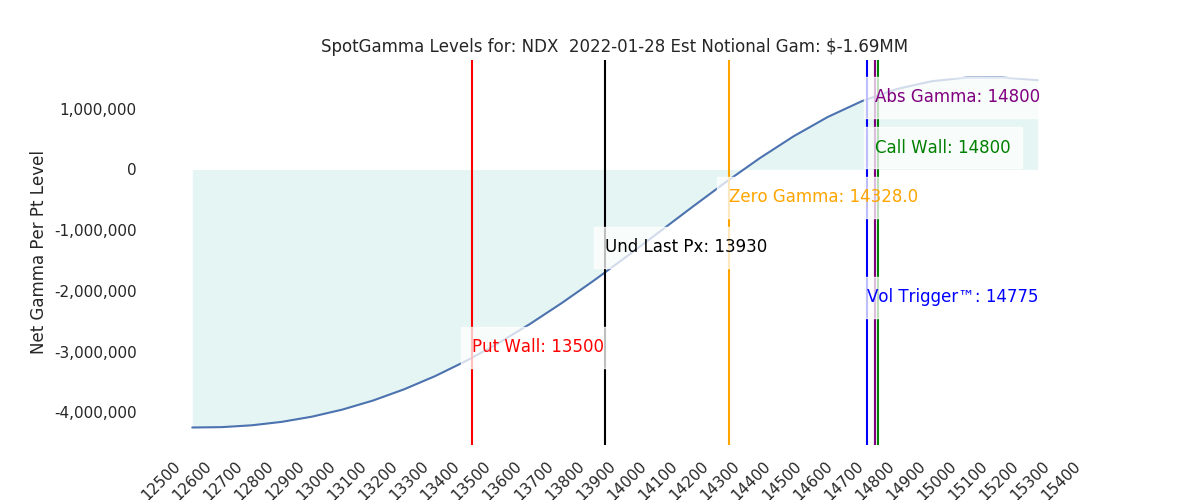
| Volatility Trigger™: | 4530 | 4590 | 449 | 14775 | 366 |
| SpotGamma Absolute Gamma Strike: | 4300 | 4300 | 430 | 14800 | 350 |
| Gamma Notional(MM): | $-866 | $-747 | $-1,590 | $-2 | $-753 |
| Additional Key Levels | Latest Data | Previous | SPY | NDX | QQQ |
|---|---|---|---|---|---|
| Zero Gamma Level: | 4544 | 4537 | 0 | 0 | 0 |
| Put Wall Support: | 4300 | 4200 | 425 | 13500 | 350 |
| Call Wall Strike: | 4700 | 4700 | 480 | 14800 | 400 |
| CP Gam Tilt: | 0.59 | 0.62 | 0.45 | 0.79 | 0.43 |
| Delta Neutral Px: | 4491 | ||||
| Net Delta(MM): | $1,548,920 | $1,565,790 | $170,485 | $37,751 | $94,333 |
| 25D Risk Reversal | -0.1 | -0.1 | -0.08 | -0.1 | -0.08 |
| Key Support & Resistance Strikes: |
|---|
| SPX: [4500, 4400, 4300, 4000] |
| SPY: [440, 430, 425, 420] |
| QQQ: [355, 350, 345, 340] |
| NDX:[15000, 14800, 14000, 13500] |
| SPX Combo (strike, %ile): [4244.0, 4145.0, 4192.0, 4291.0, 4218.0] |
| SPY Combo: [428.94, 419.02, 423.76, 433.69, 426.35] |
| NDX Combo: [14282.0, 13878.0, 13669.0, 14073.0] |