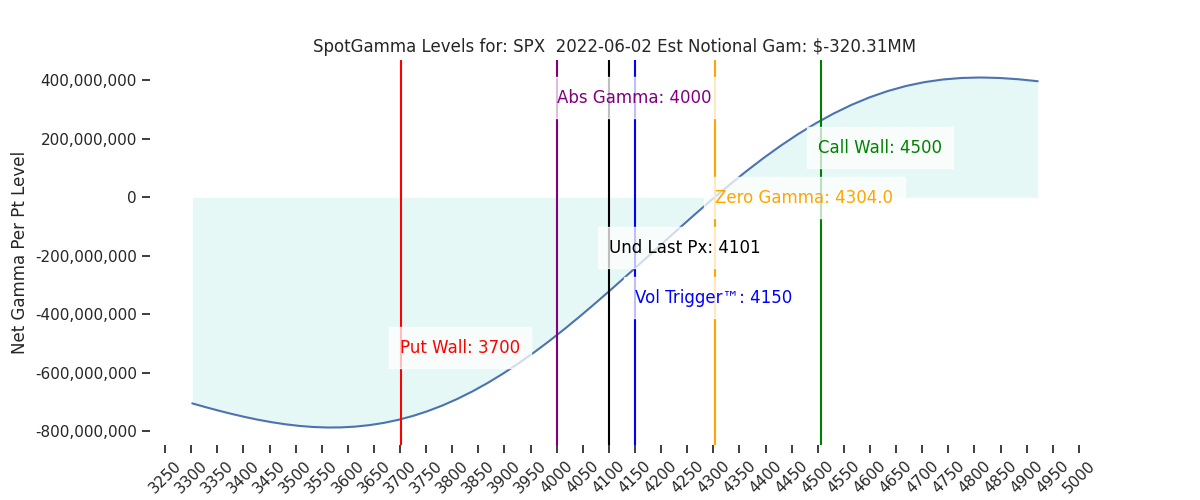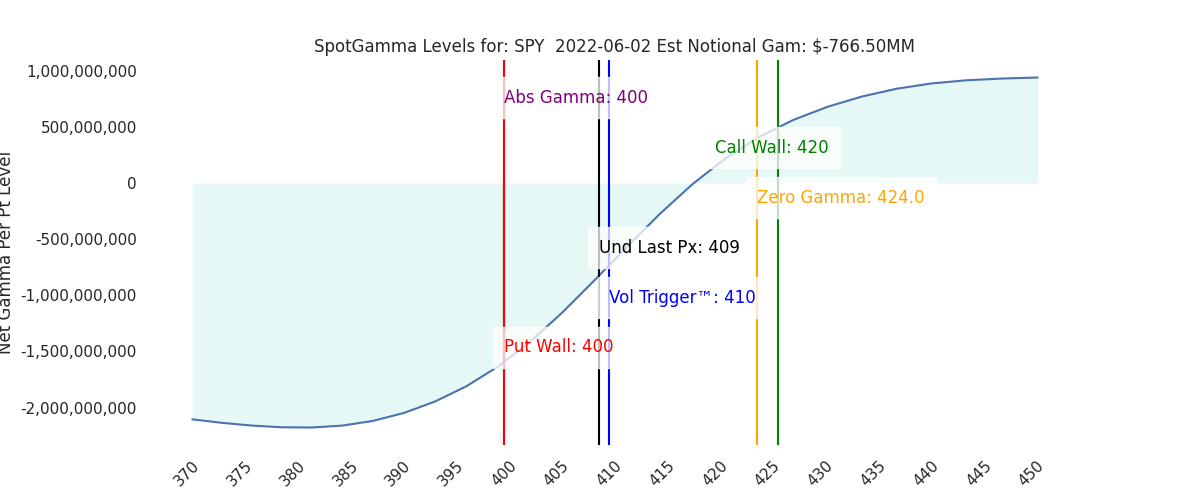
Futures have edged higher to 4120. Our models suggest similar volatility to yesterday, with an SG implied S&P move of 1.13% and VIX implied S&P move of 1.6%. 4100 remains a main support level, and key to containing volatility. To the upside we note 4150-4160 (SPY 415) as solid resistance, followed by 4200.
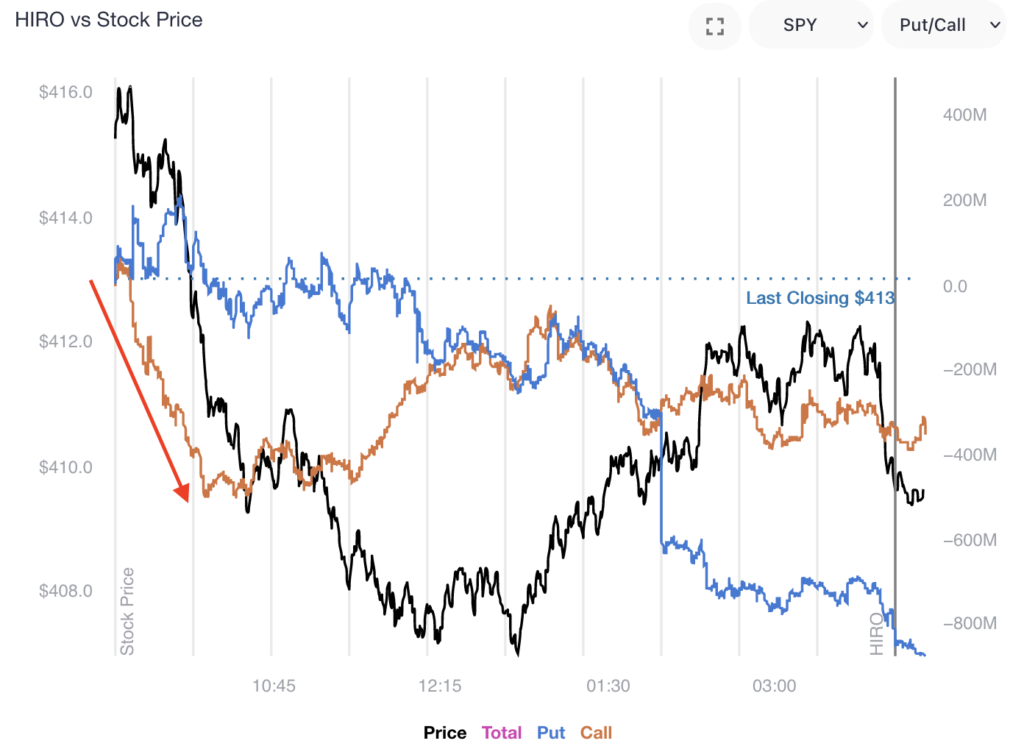
As we noted in our post last night, there seems to be a clear trend of traders selling deltas as the S&P500 tests the 4150 area. We anticipate that to continue, and as we get closer to 6/15 traders will be less willing to play short dated upside.
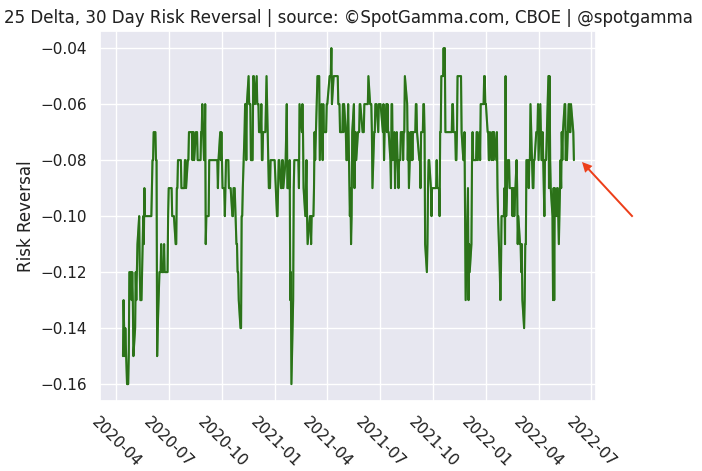
To this point we are seeing our Risk Reversal metric start to creep lower (-0.08) which is off of “bullish” readings near -0.05 last week. This suggests puts demand is increasing – and we’d again look for this to pick up towards the end of next week.
For these reasons we now think that the risk of a 4100-4200 range break is to the downside, and still are of the opinion that a break of 4100 leads to a quick test of 4000. 4000 remains large support into next week, and it may make sense for traders to start eyeing downside protection now while its relatively cheap. Into next week, focus gradually shifts to FOMC, and short dated volatility selling will start to dry up.
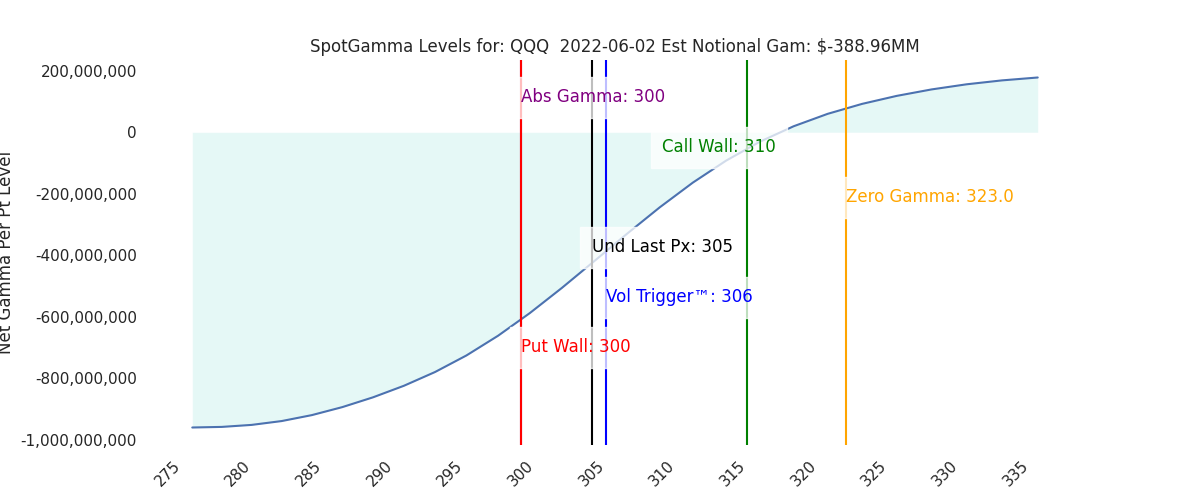
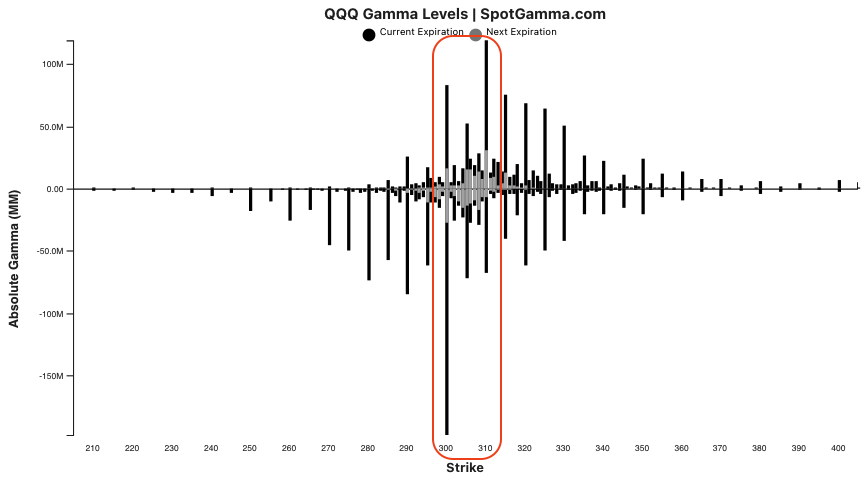
There is a clear range forming in QQQ, too. Note below the prominence of the 300 & 310 strikes, which is what we eye as the effective range into next week. Again, as we move toward FOMC we think tailwinds offered by the volatility complex reduce (i.e. short dated vol selling and/or put decay from higher stock prices) which favors markets edging toward the low end of these ranges.
Notice: Last night we held a members Q&A, you can find that replay here.
| SpotGamma Proprietary Levels | Latest Data | Previous | SPY | NDX | QQQ |
|---|---|---|---|---|---|
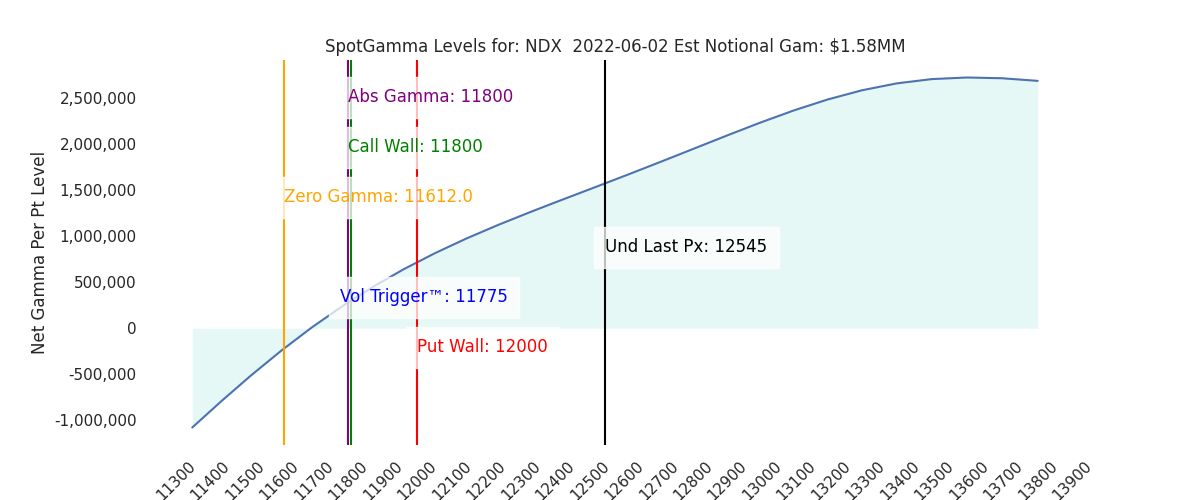
| Ref Price: | 4101 | 4101 | 409 | 12545 | 305 |
| SpotGamma Imp. 1 Day Move: Est 1 StdDev Open to Close Range | 1.13%, | (±pts): 46.0 | VIX 1 Day Impl. Move:1.62% | ||
| SpotGamma Imp. 5 Day Move: | 2.87% | 4158 (Monday Ref Px) | Range: 4039.0 | 4278.0 | ||
| SpotGamma Gamma Index™: | -0.58 | -0.51 | -0.16 | 0.01 | -0.06 |
| Volatility Trigger™: | 4150 | 4100 | 410 | 11775 | 306 |
| SpotGamma Absolute Gamma Strike: | 4000 | 4000 | 400 | 11800 | 300 |
| Gamma Notional(MM): | -320.0 | -487.38 | -767.0 | 2.0 | -389.0 |
| Additional Key Levels | Latest Data | Previous | SPY | NDX | QQQ |
|---|---|---|---|---|---|
| Zero Gamma Level: | 4304 | 4208 | 0 | 0 | 0 |
| Put Wall Support: | 3700 | 4000 | 400 | 12000 | 300 |
| Call Wall Strike: | 4500 | 4200 | 420 | 11800 | 310 |
| CP Gam Tilt: | 0.72 | 0.76 | 0.71 | 1.14 | 0.75 |
| Delta Neutral Px: | 4287 | ||||
| Net Delta(MM): | $1,080,305 | $1,756,490 | $173,246 | $59,835 | $114,960 |
| 25D Risk Reversal | -0.08 | -0.07 | -0.07 | -0.08 | -0.08 |
| Call Volume | 379,120 | 464,254 | 1,887,617 | 4,937 | 690,908 |
| Put Volume | 873,458 | 825,986 | 2,526,729 | 4,990 | 1,096,557 |
| Call Open Interest | 3,763,507 | 5,882,990 | 6,753,758 | 65,161 | 4,623,011 |
| Put Open Interest | 7,027,727 | 10,388,365 | 10,880,851 | 61,811 | 6,974,872 |
| Key Support & Resistance Strikes: |
|---|
| SPX: [4300, 4200, 4100, 4000] |
| SPY: [420, 415, 410, 400] |
| QQQ: [320, 310, 305, 300] |
| NDX:[13500, 12500, 12000, 11800] |
| SPX Combo (strike, %ile): [3998.0, 4007.0] |
| SPY Combo: [399.38, 400.2] |
| NDX Combo: [12294.0, 12708.0] |