
Futures are up to 4160. This places the 4150 SPX Call Wall above as first resistance, with resistance above there at the 420/4200 SPY Call Wall. Support below shows at 4125, then 4100. In line with last nights note, this is now the 5th session in a row wherein the SPY Call Wall has shifted higher. From a baseline we consider SG levels shifting higher as bullish as hedging flows should shift higher in kind.
One of the features of high positive gamma environments in lower realized volatility, which serves to drag implied volatility down. As this happens, interest builds at nearby strikes which creates stickier prices. The tight trading ranges associated with these environments generally favor mean-reverting trades as price churns inside large gamma bars. What we see when we look at options prices is this general expectation.
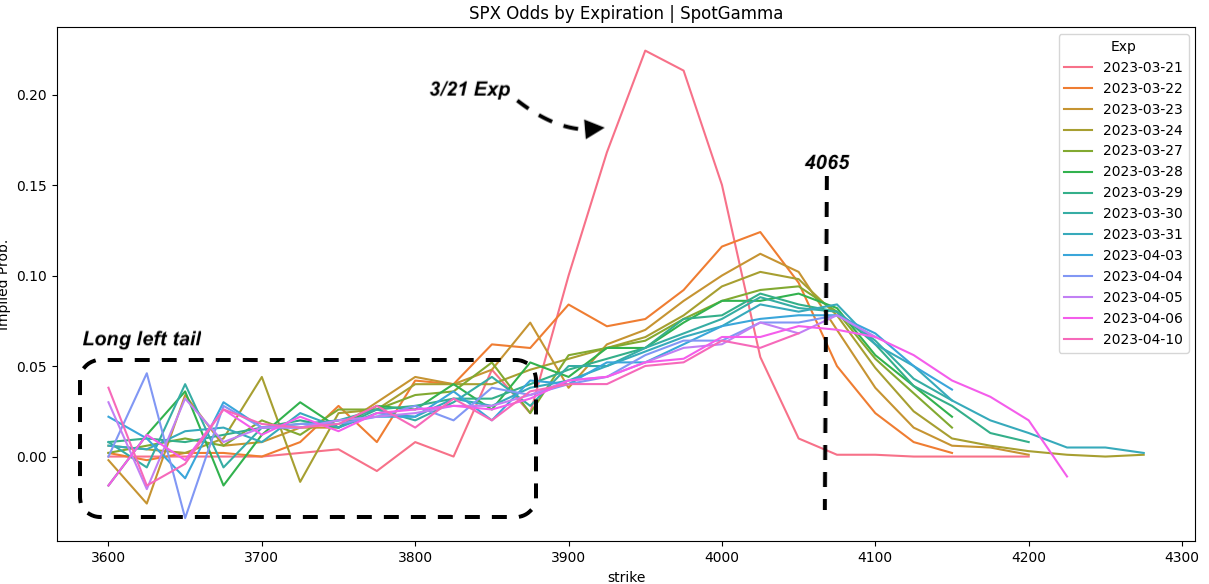
The plot below calculates the implied probability of the SPX closing at various prices, and is derived from SPX options prices. As you can see, the peak of these probabilities are around 4125, but the other thing to note is the distribution is fairly uniform over the next several expirations. This suggests there is not a strong catalyst for price change from some type of event. If there was an event (ex: FOMC) then there would be a stark shift to a flatter (platykurtic) probability (see this image from 3/21 as an example).

The other thing about these environments is it generally takes a few days to work of the low IV, positive gamma position. This suggests that sharp declines are unlikely, barring some type of really nasty headline. This is because hedging flows should serve to suppress volatility, and are likely to do so until we get down into the 4000-4050 area. The other scenario which can open up volatility is a large expiration as it clears large gamma strikes – but we are several weeks away from April monthly OPEX.
We do not see anything particularly unusual in SPX call skew – it remains fairly normal with IV decreasing as markets rally. Where things are a bit more interesting is in tech, where we see shades of fixed strike IV increasing at strikes overhead. This suggests that there is some incremental demand for long options. You can see this via the table below, wherein the shades of red indicated IV increasing for these strikes. Therefore while we see tighter relative trading ranges in the S&P, we could see higher relative volatility in QQQ – which works both to the upside & downside. The other interesting note here is that this IV bid is a feature of shorted dated options, with IV decreasing for strikes out past April OPEX.

This could setup some interesting spread trades across top Index/ETF’s. On this topic we’d note the relative tech outperformance has slowed as you can see below. Immediately out of the mid-March bank crisis it was tech that outperformed, but now we see “non-tech” catching up.
In summary, our view had been that we would see some price consolidation with markets testing the 4000-4050 area. The persistent roll higher in the SPY Call Wall, build in positive gamma, reduction in RV/IV still favors consolidation (i.e. tighter trading ranges), but sharp +1% declines (on a close to close basis) start to slip out of favor here. We would likely need several days of “grind down” weakness before larger moves become available. This “grind” works the same way to the upside, as the S&P is more likely to “drift & grind” vs sharp +1% jabs.
For those of you looking to play the long gamma side (i.e. stocks breaking out or down), we generally favor single stocks and/or QQQ vs S&P because, as the dynamics outlined above suggest, the S&P should have relatively sluggish volatility.
|
SpotGamma Proprietary Levels |
SPX |
SPY |
NDX |
QQQ |
RUT |
IWM |
|
Reference Price: |
$4124 |
$410 |
$13148 |
$320 |
$1802 |
$178 |
|
SpotGamma Implied 1-Day Move: |
1.06% |
1.06% |
||||
|
SpotGamma Implied 5-Day Move: |
2.69% |
|||||
|
SpotGamma Volatility Trigger™: |
$4005 |
$409 |
$11975 |
$319 |
$1900 |
$180 |
|
Absolute Gamma Strike: |
$4000 |
$410 |
$12525 |
$320 |
$1800 |
$180 |
|
SpotGamma Call Wall: |
$4150 |
$420 |
$12525 |
$330 |
$1735 |
$182 |
|
SpotGamma Put Wall: |
$3800 |
$400 |
$11000 |
$285 |
$1600 |
$170 |
|
Additional Key Levels |
SPX |
SPY |
NDX |
QQQ |
RUT |
IWM |
|
Zero Gamma Level: |
$4180 |
$450 |
$12555 |
$360 |
$1765 |
$212 |
|
Gamma Tilt: |
1.5 |
1 |
1.9 |
1.1 |
0.66 |
0.53 |
|
SpotGamma Gamma Index™: |
1.4 |
0.0015 |
0.044 |
0.03 |
-0.019 |
-0.077 |
|
Gamma Notional (MM): |
$3.7B |
$7.8B |
$22M |
$3B |
$103M |
$2.8B |
|
25 Day Risk Reversal: |
-5.06% |
-4.40% |
-5.01% |
-5.22% |
-4.52% |
-4.70% |
|
Call Volume: |
569K |
2M |
9.7K |
598K |
10K |
178K |
|
Put Volume: |
907K |
3.1M |
11K |
956K |
23K |
468K |
|
Call Open Interest: |
5.7M |
6.8M |
52K |
4.5M |
164K |
3.1M |
|
Put Open Interest: |
11M |
14M |
59K |
7.9M |
310K |
7.1M |
|
Key Support & Resistance Strikes |
|
SPX Levels: [4200, 4150, 4100, 4000] |
|
SPY Levels: [412, 410, 408, 400] |
|
NDX Levels: [14000, 13500, 13000, 12525] |
|
QQQ Levels: [320, 315, 310, 300] |