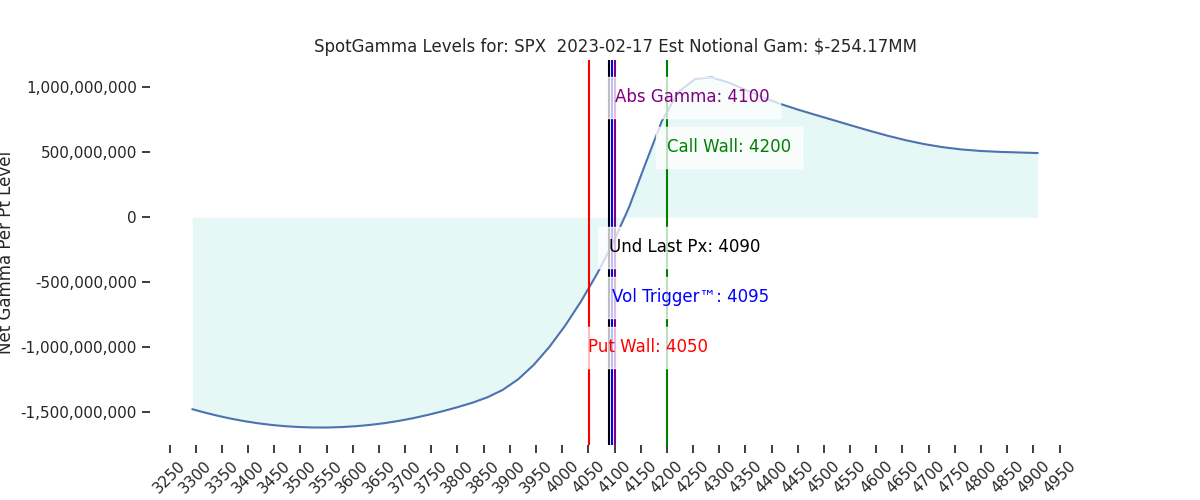
Futures have broken lower, to 4070. We note several downside support levels just under current prices at 4060 (SPY 405) and the 4050 SPX Put Wall. Beneath there the next major level is long term 4000 support. Above we mark 4100-4110(SPY410) as resistance, followed by 4150.
We give edge to markets closing above 4050 today due not only to current positions expiring, but also a disincentive for traders to carry long options positions over the extended weekend (Monday is a US market holiday). This may lead traders to monetize/spread off downside today.
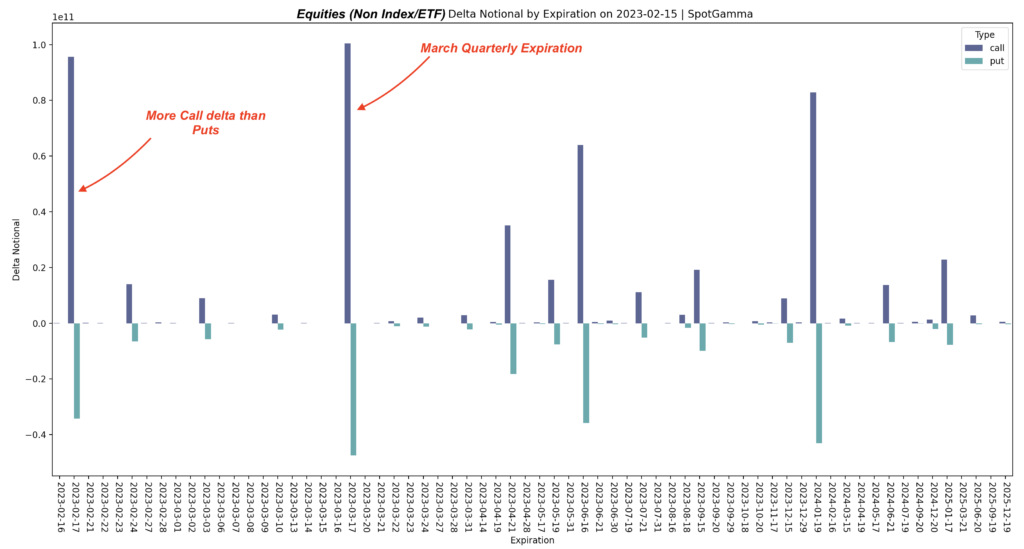
The top line theme here is that many of the positions which were boxing markets into the 4100-4200 area are expiring. With that, todays weakness, and loss of 4100, is in line with our expectations that markets could weaken into and out of OPEX (additionally see August analogy).
We would anticipate weakness remaining into early next week, and/or a test of 4000. For a break below 4000 we believe that markets would need an additional catalyst (hawkish Fed-speak, bad data, etc).
This edge to downside is because net call positions across index/stocks are expiring (as shown below) which has historically led to some mean reversion/consolidation of gains. While todays expiration is material in size, its only about 1/2 that of January. Looking ahead, March OPEX is very large and likely a key market turning point.
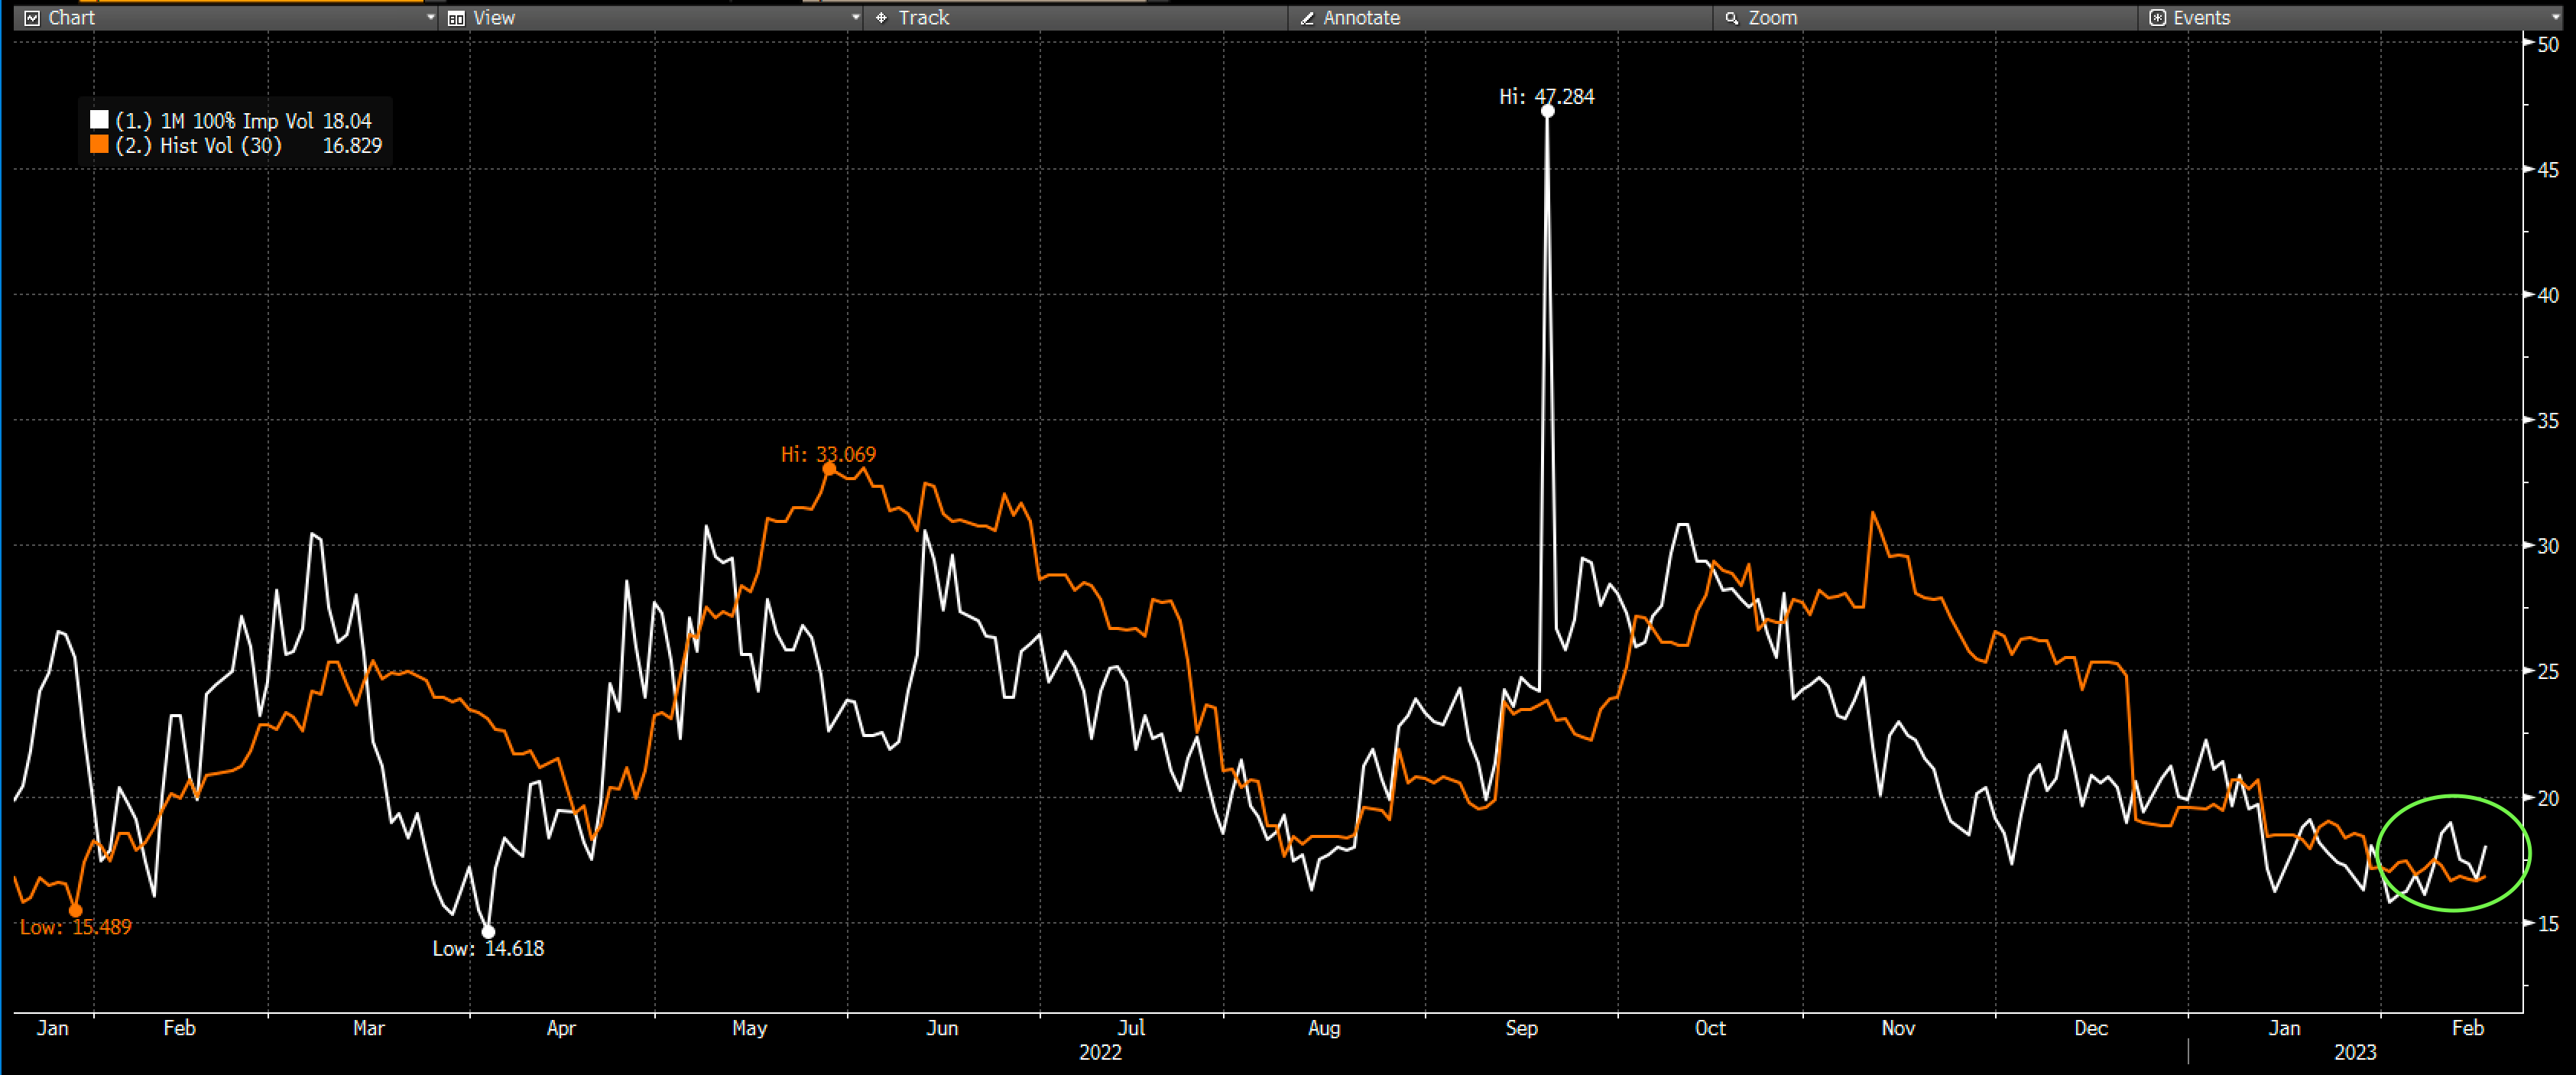
As markets are digesting recent highs, we still have some unresolved issues vis-à-vis implied volatility compression. The thinking here is that the spread between RV & IV has collapsed, and markets would need a dovish change in rate expectations to allow RV to decline. If RV does not shift lower, then IV is too cheap and needs to be bought. This could lead to market weakness.
As you can see below, RV (orange) and IV (are quite compressed as we approach Feb OPEX, which should lead to a tick up in RV. We also note that IV is not declining, which suggest traders are not pricing in lower volatility ahead – and in fact signs are pointing to traders buying hedges.
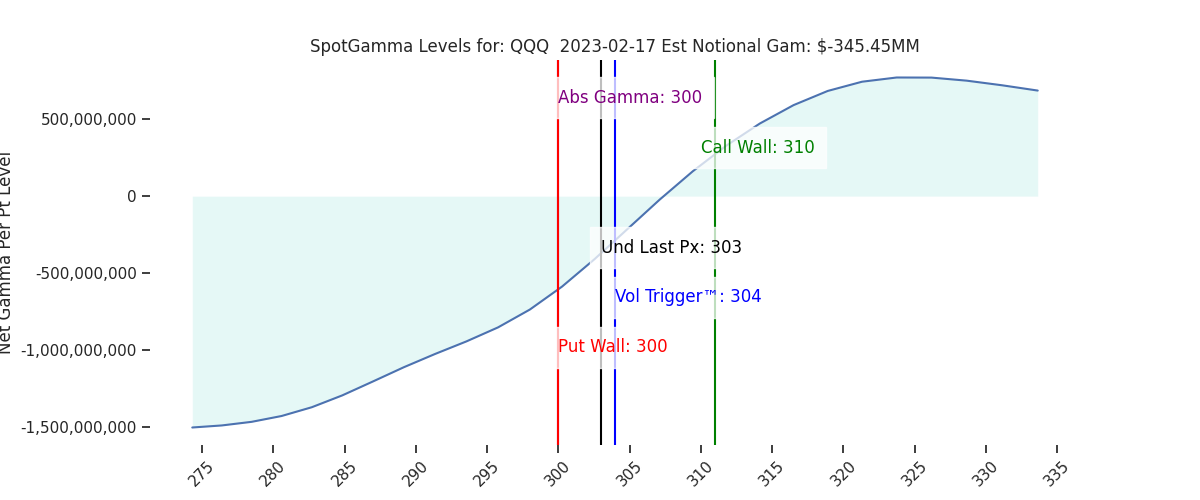
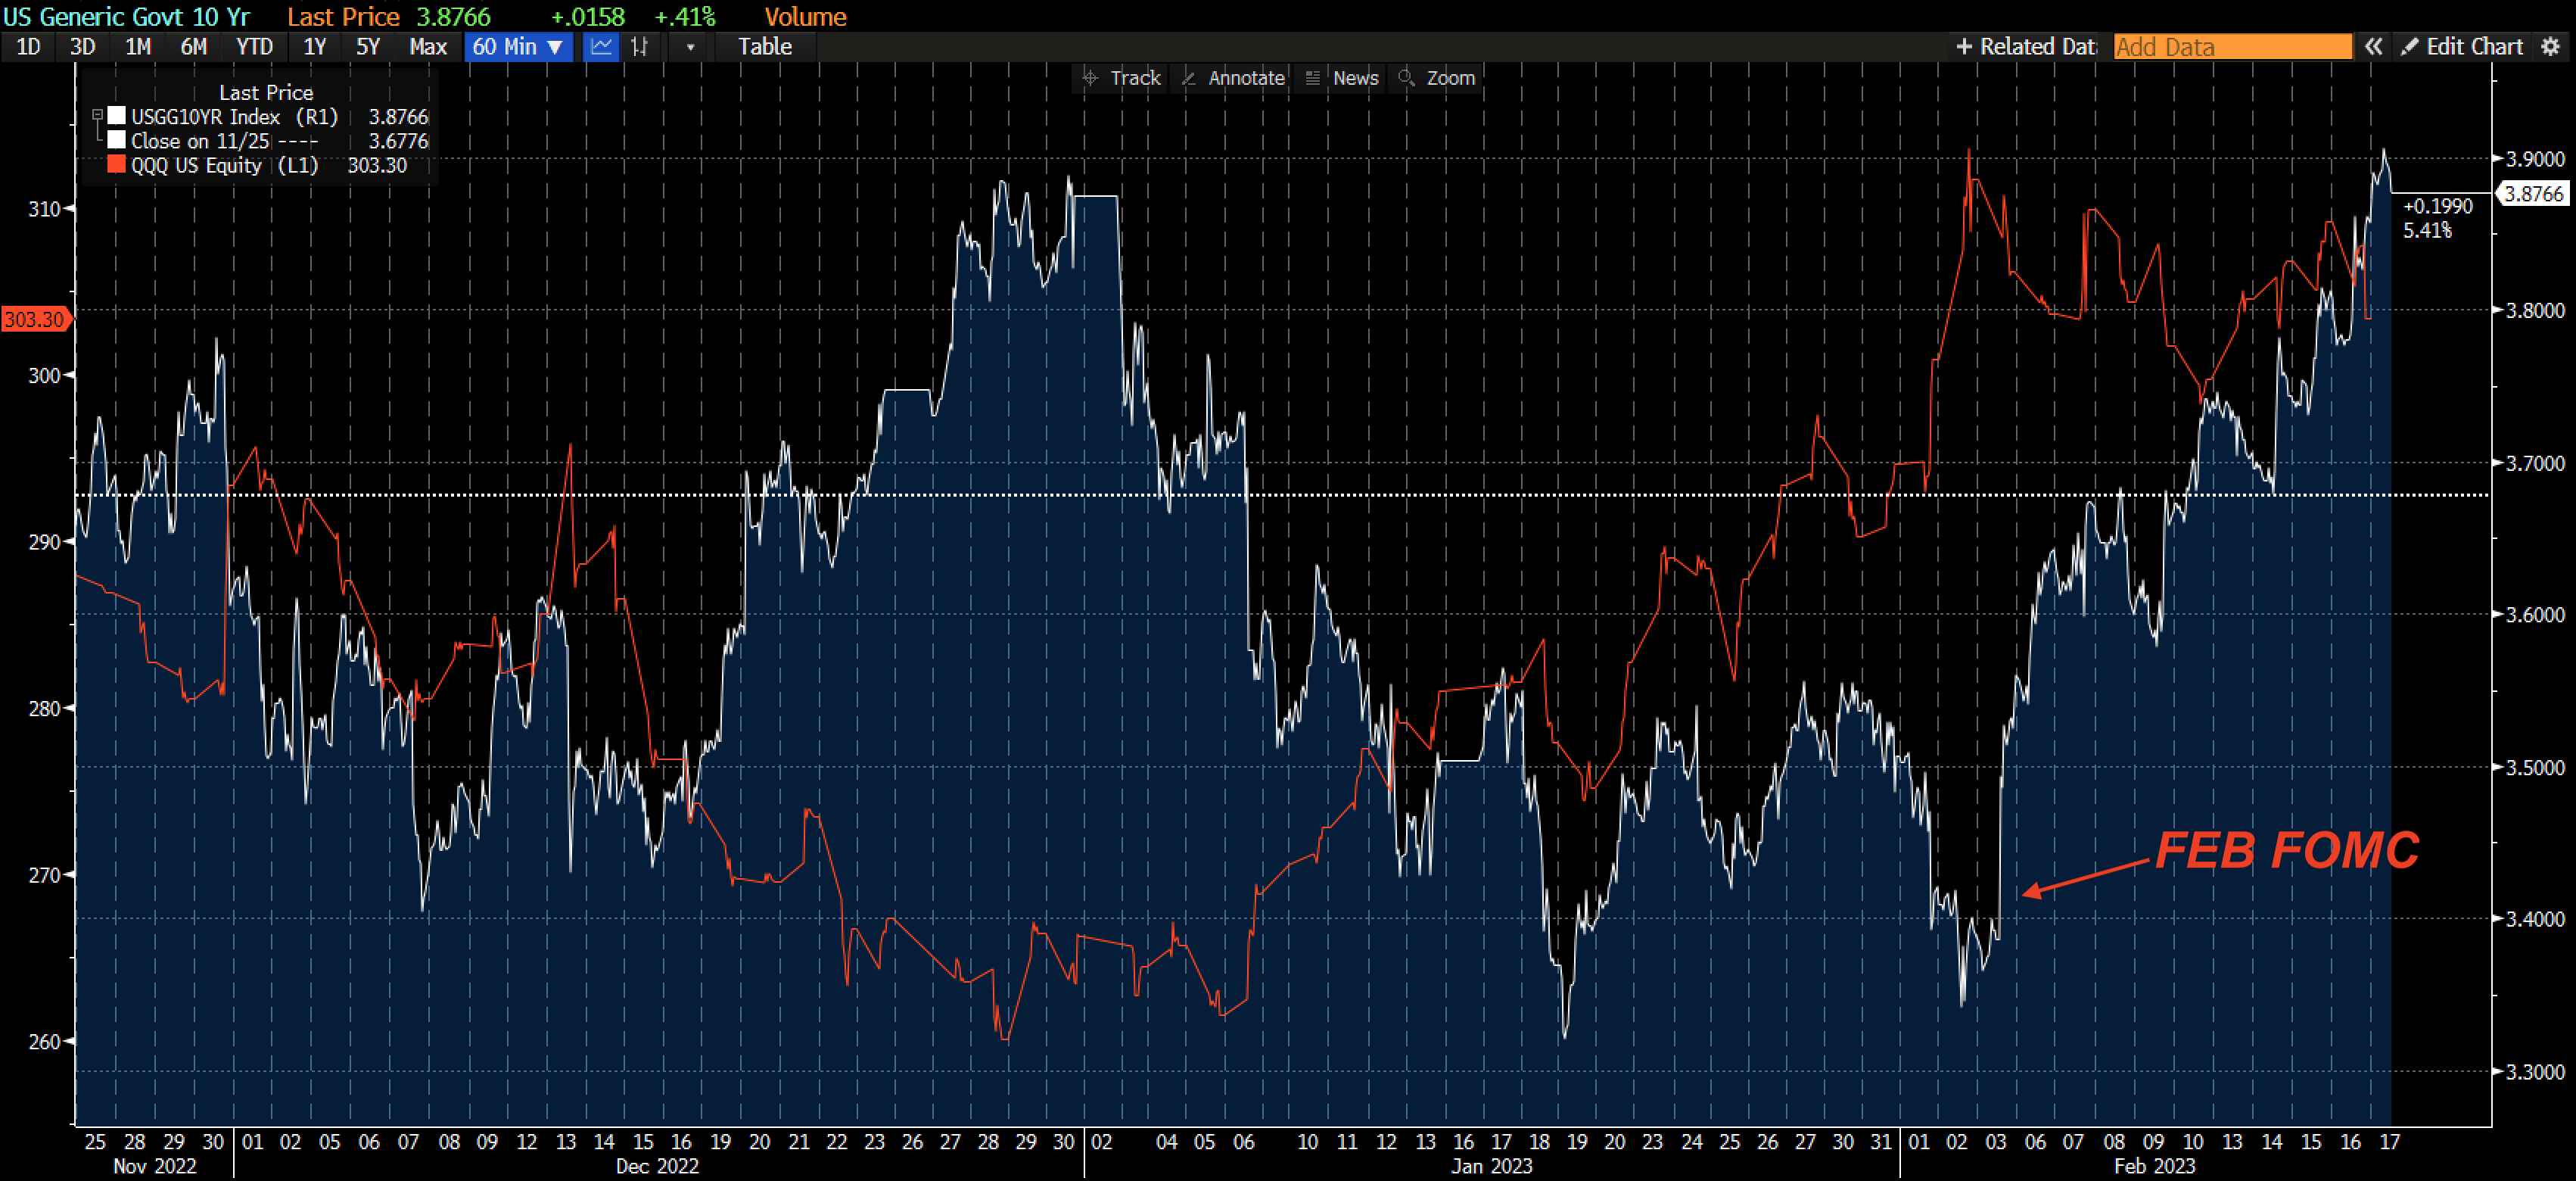
Further, while we do not cover rates markets, we can see that yields are pushing higher (white) – back to Dec levels. The QQQ has rallied +15% since December lows, as shown in red. The base implication here is that rate volatility should continue to be destabilizing for equity markets. On this point many are attributing yesterdays late day decline to hawkish Fed statements.
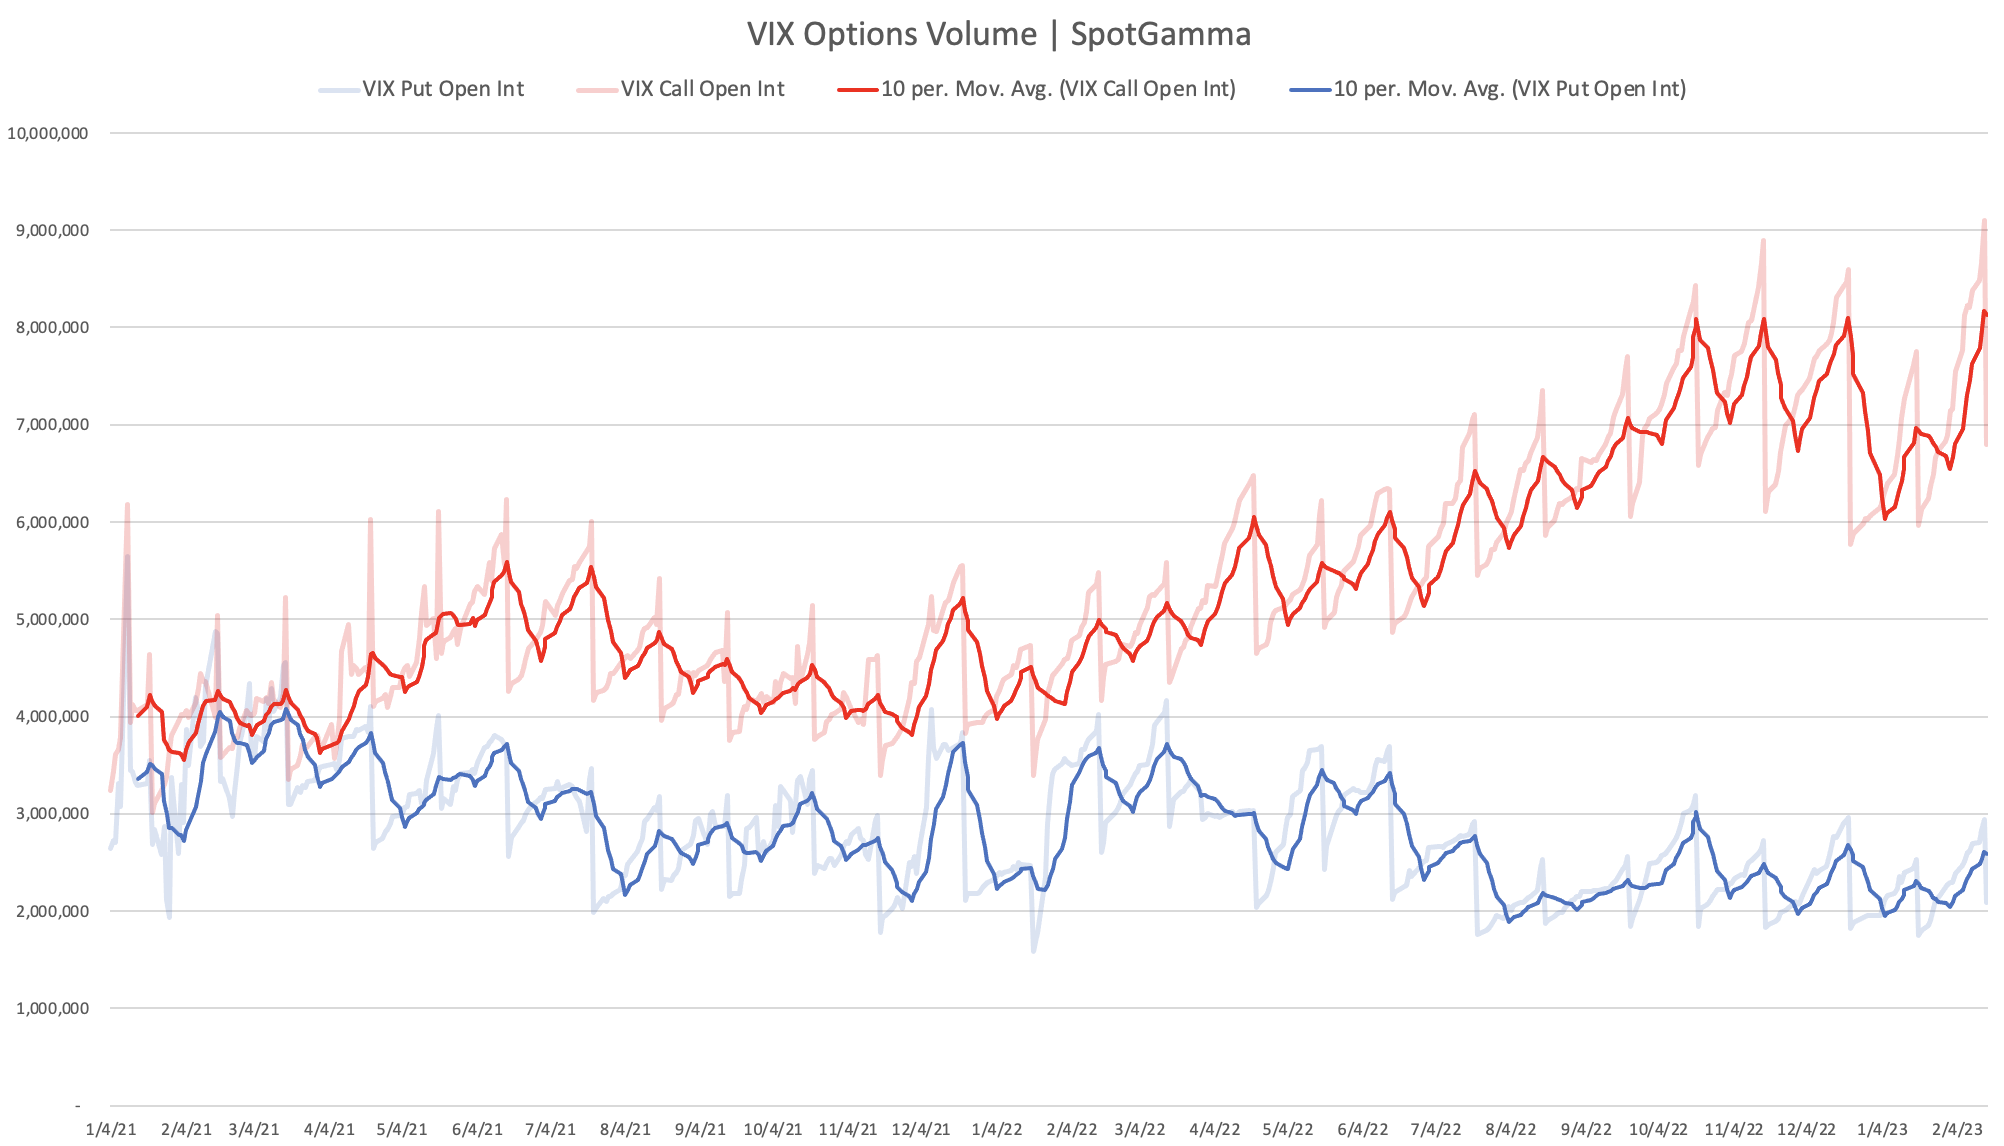
Recently we have been covering the rise in VIX call purchases, and denouncing cries of “The VIX is dead” (due to 0DTE). To this point, a trader rolled an 80k July VIX 60 calls position yesterday – and these larger VIX trades seem to be happening with more frequency. To look at this, we plotted VIX call & put open interest below. As you can see the open interest of VIX call positions is at 2 year highs, having accelerated into Q4 of last year. The implication here is that if markets pop lower, there is more fuel to drive volatility (i.e. VIX map jump if markets drop, unlike last year).
Our overall read here is that we see less resistance for a move lower vs move higher given the dynamics outlined above. There are clearly signs of hedging and volatility buying as markets hit this interim top. While we think markets testing and holding above 4000 is “bullish consolidation”(our current view is that 4000 will hold into early next week), a break of 4000 is a signal that a significant spike in volatility is incoming.
| SpotGamma Proprietary SPX Levels | Latest Data | SPX Previous | SPY | NDX | QQQ |
|---|---|---|---|---|---|
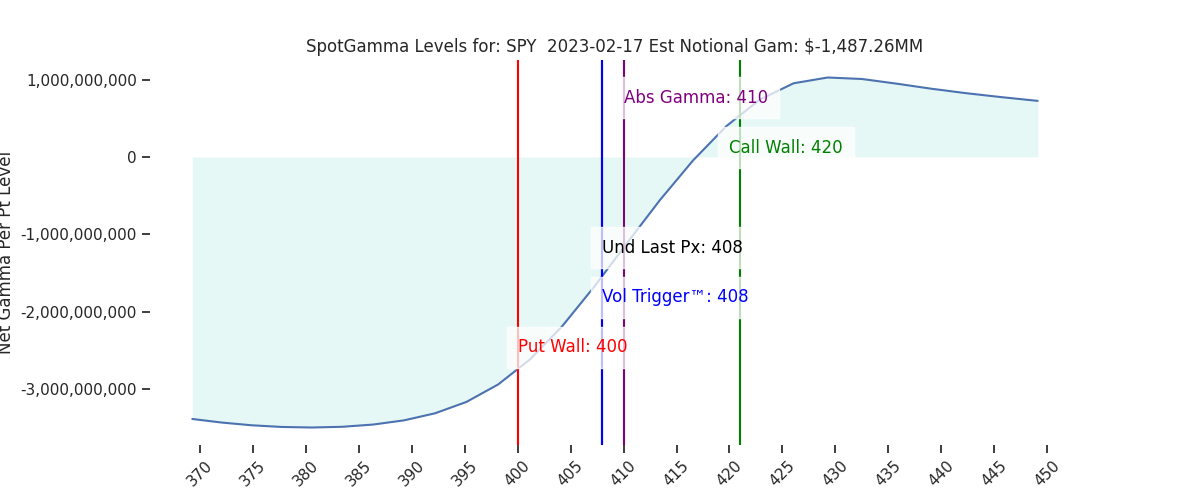
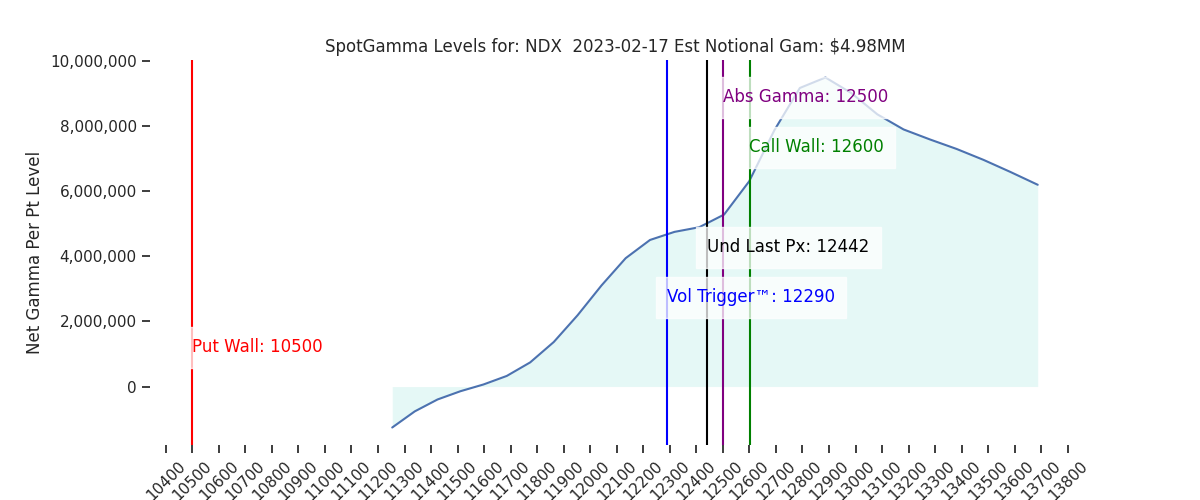
| Ref Price: | 4090 | 4132 | 408 | 12442 | 303 |
| SG Implied 1-Day Move:: | 0.9%, | (±pts): 37.0 | VIX 1 Day Impl. Move:1.27% | ||
| SG Implied 5-Day Move: | 2.76% | 4090 (Monday Ref Price) | Range: 3978.0 | 4203.0 | ||
| SpotGamma Gamma Index™: | 0.09 | 1.33 | -0.27 | 0.03 | -0.05 |
| Volatility Trigger™: | 4095 | 4060 | 408 | 12290 | 304 |
| SpotGamma Absolute Gamma Strike: | 4100 | 4150 | 410 | 12500 | 300 |
| Gamma Notional(MM): | -254.0 | 258.0 | -1487.0 | 5.0 | -345.0 |
| Put Wall: | 4050 | 3900 | 400 | 10500 | 300 |
| Call Wall : | 4200 | 4200 | 420 | 12600 | 310 |
| Additional Key Levels | Latest Data | Previous | SPY | NDX | QQQ |
|---|---|---|---|---|---|
| Zero Gamma Level: | 4107 | 4118 | 417.0 | 11521.0 | 317 |
| CP Gam Tilt: | 1.02 | 1.12 | 0.7 | 1.32 | 0.82 |
| Delta Neutral Px: | 4026 | ||||
| Net Delta(MM): | $1,705,511 | $1,639,869 | $197,887 | $62,534 | $102,102 |
| 25D Risk Reversal | -0.06 | -0.05 | -0.06 | -0.06 | -0.06 |
| Call Volume | 725,750 | 517,606 | 2,260,056 | 12,901 | 724,678 |
| Put Volume | 1,233,388 | 1,012,852 | 3,474,527 | 9,837 | 1,107,518 |
| Call Open Interest | 6,324,353 | 6,249,004 | 6,799,824 | 68,274 | 4,958,546 |
| Put Open Interest | 11,930,825 | 11,407,951 | 15,221,012 | 72,403 | 8,946,047 |
| Key Support & Resistance Strikes: |
|---|
| SPX: [4150, 4100, 4050, 4000] |
| SPY: [415, 410, 405, 400] |
| QQQ: [310, 305, 300, 290] |
| NDX:[13000, 12600, 12500, 12000] |
| SPX Combo (strike, %ile): [(4274.0, 83.36), (4250.0, 92.61), (4225.0, 83.58), (4209.0, 76.14), (4201.0, 96.02), (4188.0, 78.54), (4176.0, 92.69), (4168.0, 75.34), (4152.0, 93.62), (4139.0, 81.81), (4098.0, 93.34), (4078.0, 82.11), (4074.0, 81.28), (4070.0, 81.63), (4066.0, 82.33), (4049.0, 95.62), (4008.0, 87.95), (3955.0, 78.6), (3951.0, 91.72), (3927.0, 81.32), (3906.0, 82.11), (3898.0, 93.95)] |
| SPY Combo: [419.3, 404.2, 389.09, 414.4, 409.1] |
| NDX Combo: [12306.0, 12716.0, 11895.0, 12928.0, 12604.0] |