Futures are off slightly to 4050 following Fridays OPEX. Following OPEX, the 4100 level has lost a good deal of its gamma weighting, but remains primary resistance for today. Support below lies at 4050, then 4000.
We have been on the lookout for some price consolidation to start this week, with the 400SPY/4000SPX strike functioning as major support due to it being the strike with the largest gamma. Our base case is for markets to trade around 4050 today, with tomorrows 2pm ET FOMC minutes as the next major catalyst. For today, prices can move quite freely to 4100 or 4000, but we would expect those levels to hold, with trade mean reverting back towards 4050.
Zooming out, as you can see below, under 400SPY (and 4000 SPX) there are purely put positions (teal bars). As a result, if markets do break this pivotal 4000 level we will likely see a large spike in IV, corresponding with a large equity move lower. We would market this as a significant risk-off event as we get IV expansion and “vega” starts to wash over “0DTE” as the dominant hedging force.
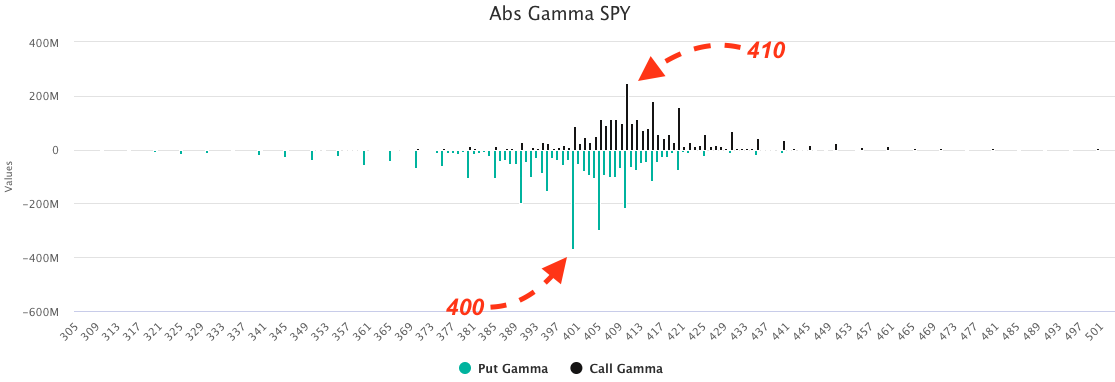
Note that any market weakness today/tomorrow AM would likely result in prices “staging” at the 4000 level first (meaning the S&P trades around this 4000 level rather than plowing through it), giving traders some time to consider downside hedges.
With some of the OPEX pinning/guardrail positioning expired, a bad data print can now do more damage.
If we were to draw out the “bad dream” scenario for bulls here, it would be a move to 4000 today with traders eyeing tomorrows 2pm ET FOMC mins. A bad read of out those minutes would then pop the market down <4000 into a negative gamma/vanna feedback loop. This is the unwinding of the IV compression that we’ve been discussing here.
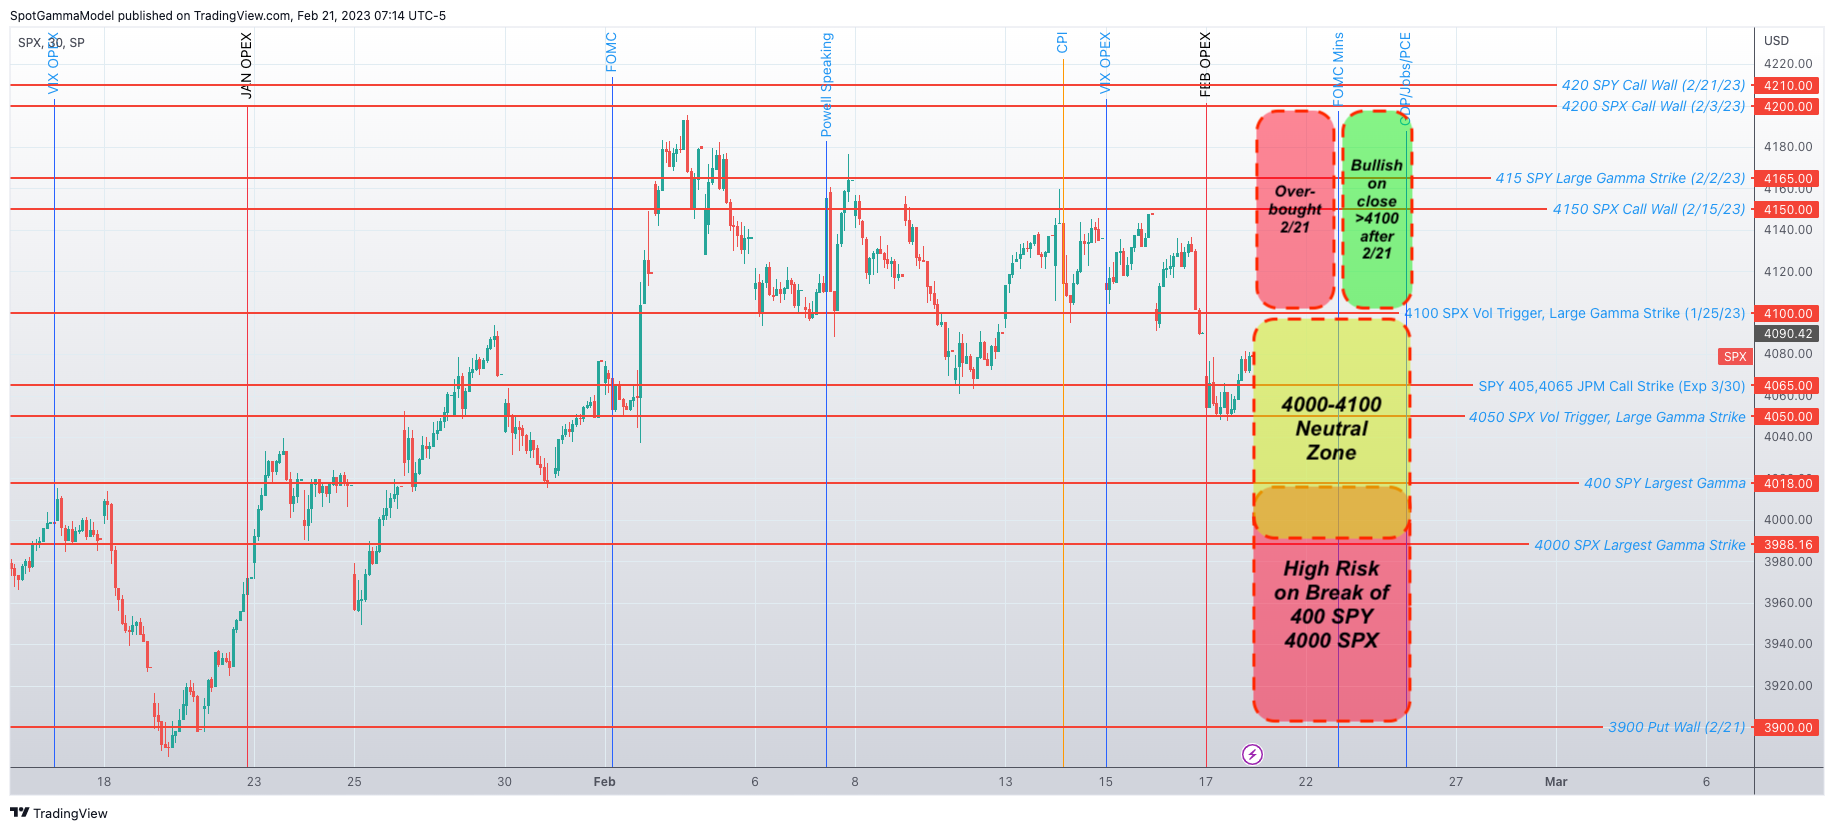
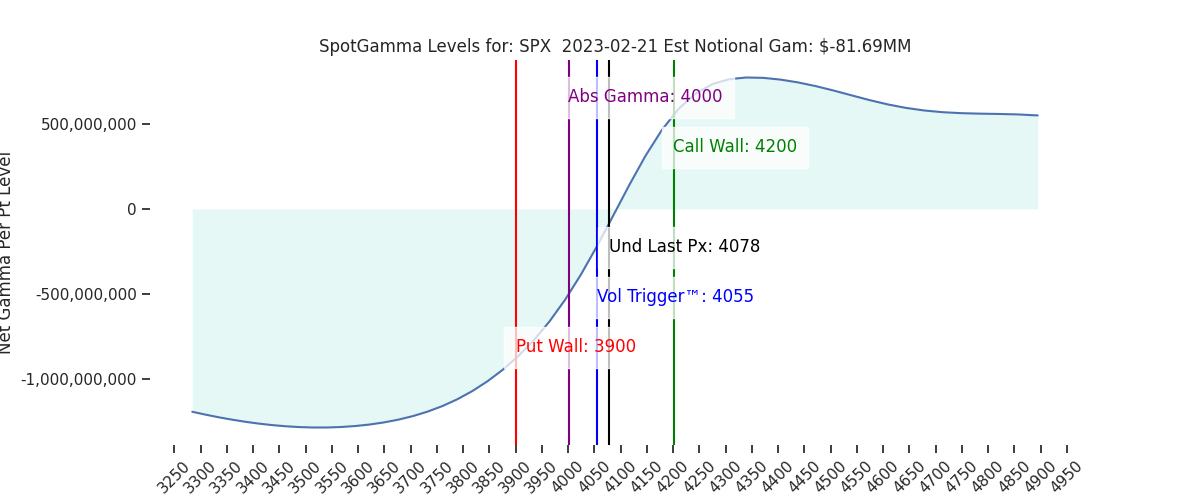
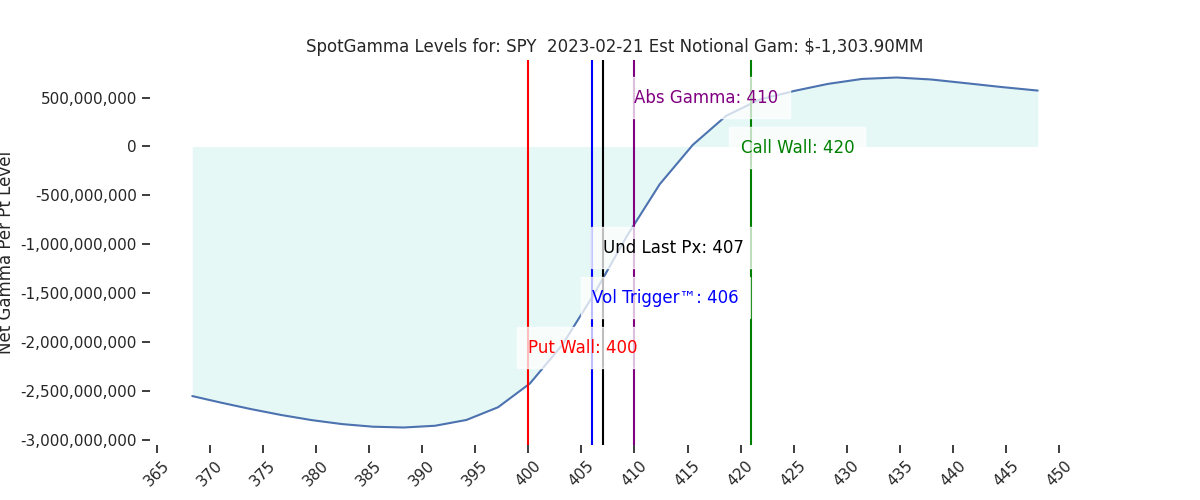
To the upside we see no reason for markets to “surprise” sharply higher this week. The Call Walls remain at 420 SPY/4200 SPX and a positive take (or event FOMC minutes non-event) allows for some IV rolloff and a vanna-boost up into the 4100 area Wednesday/Thursday. We would then anticipate traders attention immediately turning to Fridays GDP/Jobs/PCE data prints.
| SpotGamma Proprietary SPX Levels | Latest Data | SPX Previous | SPY | NDX | QQQ |
|---|---|---|---|---|---|
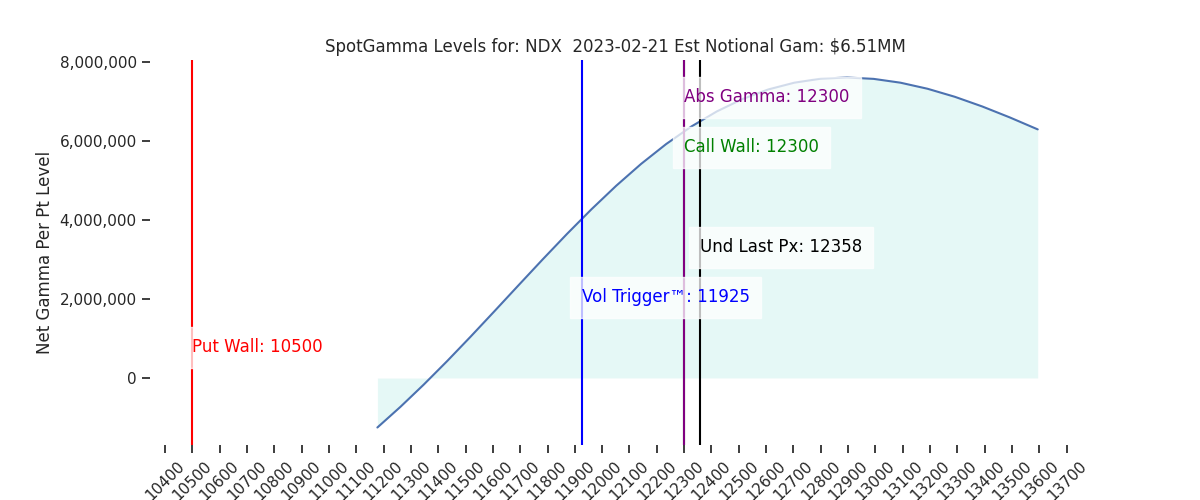
| Ref Price: | 4078 | 4078 | 407 | 12358 | 301 |
| SG Implied 1-Day Move:: | 0.98%, | (±pts): 40.0 | VIX 1 Day Impl. Move:1.25% | ||
| SG Implied 5-Day Move: | 2.33% | 4078 (Monday Ref Price) | Range: 3984.0 | 4174.0 | ||
| SpotGamma Gamma Index™: | 0.21 | 0.08 | -0.28 | 0.04 | -0.06 |
| Volatility Trigger™: | 4055 | 4060 | 406 | 11925 | 304 |
| SpotGamma Absolute Gamma Strike: | 4000 | 4000 | 410 | 12300 | 300 |
| Gamma Notional(MM): | -82.0 | -157.0 | -1304.0 | 7.0 | -377.0 |
| Put Wall: | 3900 | 3900 | 400 | 10500 | 290 |
| Call Wall : | 4200 | 4200 | 420 | 12300 | 310 |
| Additional Key Levels | Latest Data | Previous | SPY | NDX | QQQ |
|---|---|---|---|---|---|
| Zero Gamma Level: | 4096 | 4096 | 412.0 | 11357.0 | 315 |
| CP Gam Tilt: | 1.05 | 0.93 | 0.67 | 1.62 | 0.78 |
| Delta Neutral Px: | 4014 | ||||
| Net Delta(MM): | $1,489,707 | $1,513,626 | $170,911 | $51,817 | $94,827 |
| 25D Risk Reversal | -0.06 | -0.07 | -0.06 | -0.06 | -0.07 |
| Call Volume | 488,122 | 488,122 | 1,883,232 | 19,858 | 700,827 |
| Put Volume | 1,047,966 | 1,047,966 | 2,615,531 | 11,660 | 1,200,045 |
| Call Open Interest | 5,550,965 | 5,689,357 | 5,727,684 | 59,929 | 4,495,754 |
| Put Open Interest | 10,079,841 | 10,524,412 | 12,131,395 | 58,733 | 7,770,911 |
| Key Support & Resistance Strikes: |
|---|
| SPX: [4150, 4100, 4050, 4000] |
| SPY: [415, 410, 405, 400] |
| QQQ: [310, 305, 300, 290] |
| NDX:[13000, 12300, 12000, 11500] |
| SPX Combo (strike, %ile): [(4275.0, 82.62), (4250.0, 90.46), (4226.0, 82.09), (4201.0, 95.3), (4177.0, 90.97), (4148.0, 90.59), (4099.0, 85.48), (4067.0, 86.66), (4054.0, 84.28), (4005.0, 88.49), (4001.0, 82.74), (3956.0, 74.98), (3948.0, 89.63), (3924.0, 83.15), (3908.0, 78.3), (3899.0, 93.71)] |
| SPY Combo: [419.48, 389.34, 417.03, 414.18, 424.36] |
| NDX Combo: [12296.0, 11901.0, 12717.0, 12309.0, 12111.0] |

0 comentarios