Daily Note:
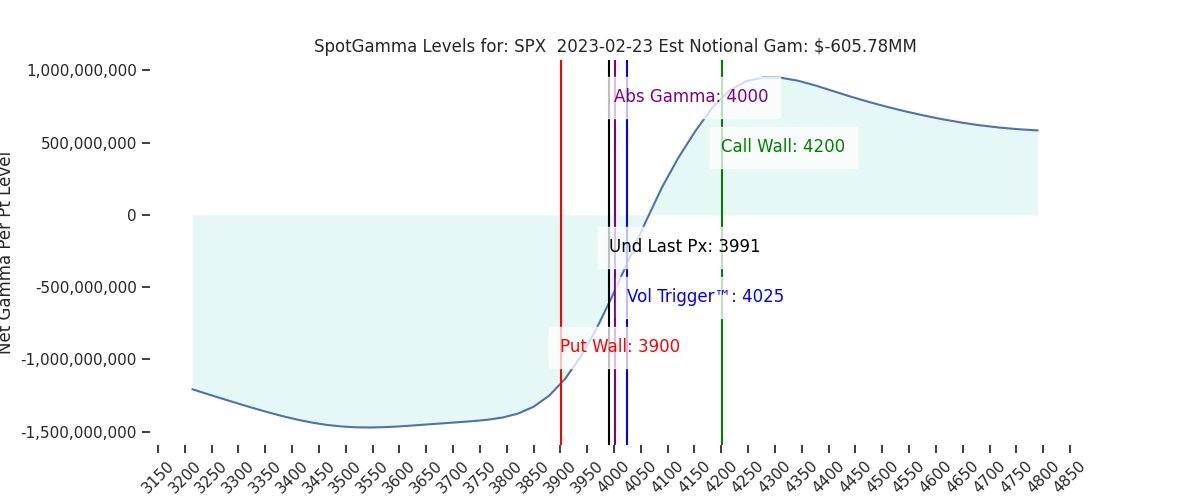
Futures are higher to 4015. SG levels are unchanged, with 4000 holding as the major pivot level. Resistance above lies at 4010 (SPY 400) then 4050. Below 4000 we now see support at 3976, then 3950.
Our view yesterday was that a break of the key 4000 level would spill into a larger, more significant drawdown for equities. That setup seemed to be in place following the 2pm ET FOMC mins, as the S&P began sliding lower into 3pm ET – despite what seemed like an FOMC mins non-event.
The selling, it appears, was a 0DTE driven head-fake and not longer dated hedges. We state this as there was a sharp increase in S&P (SPX+SPY) 0DTE negative deltas (teal line, starting near 14:15 ET).
Then, as the SPX hit 3980, the deltas began turning sharply positive (put sellers), pushing the market higher with it. The implication here is that broader forces remained on the sidelines while 0DTE maintained control. Ultimately the SPX closed at 3990, which is SPY 398 (the importance of which is outlined below).
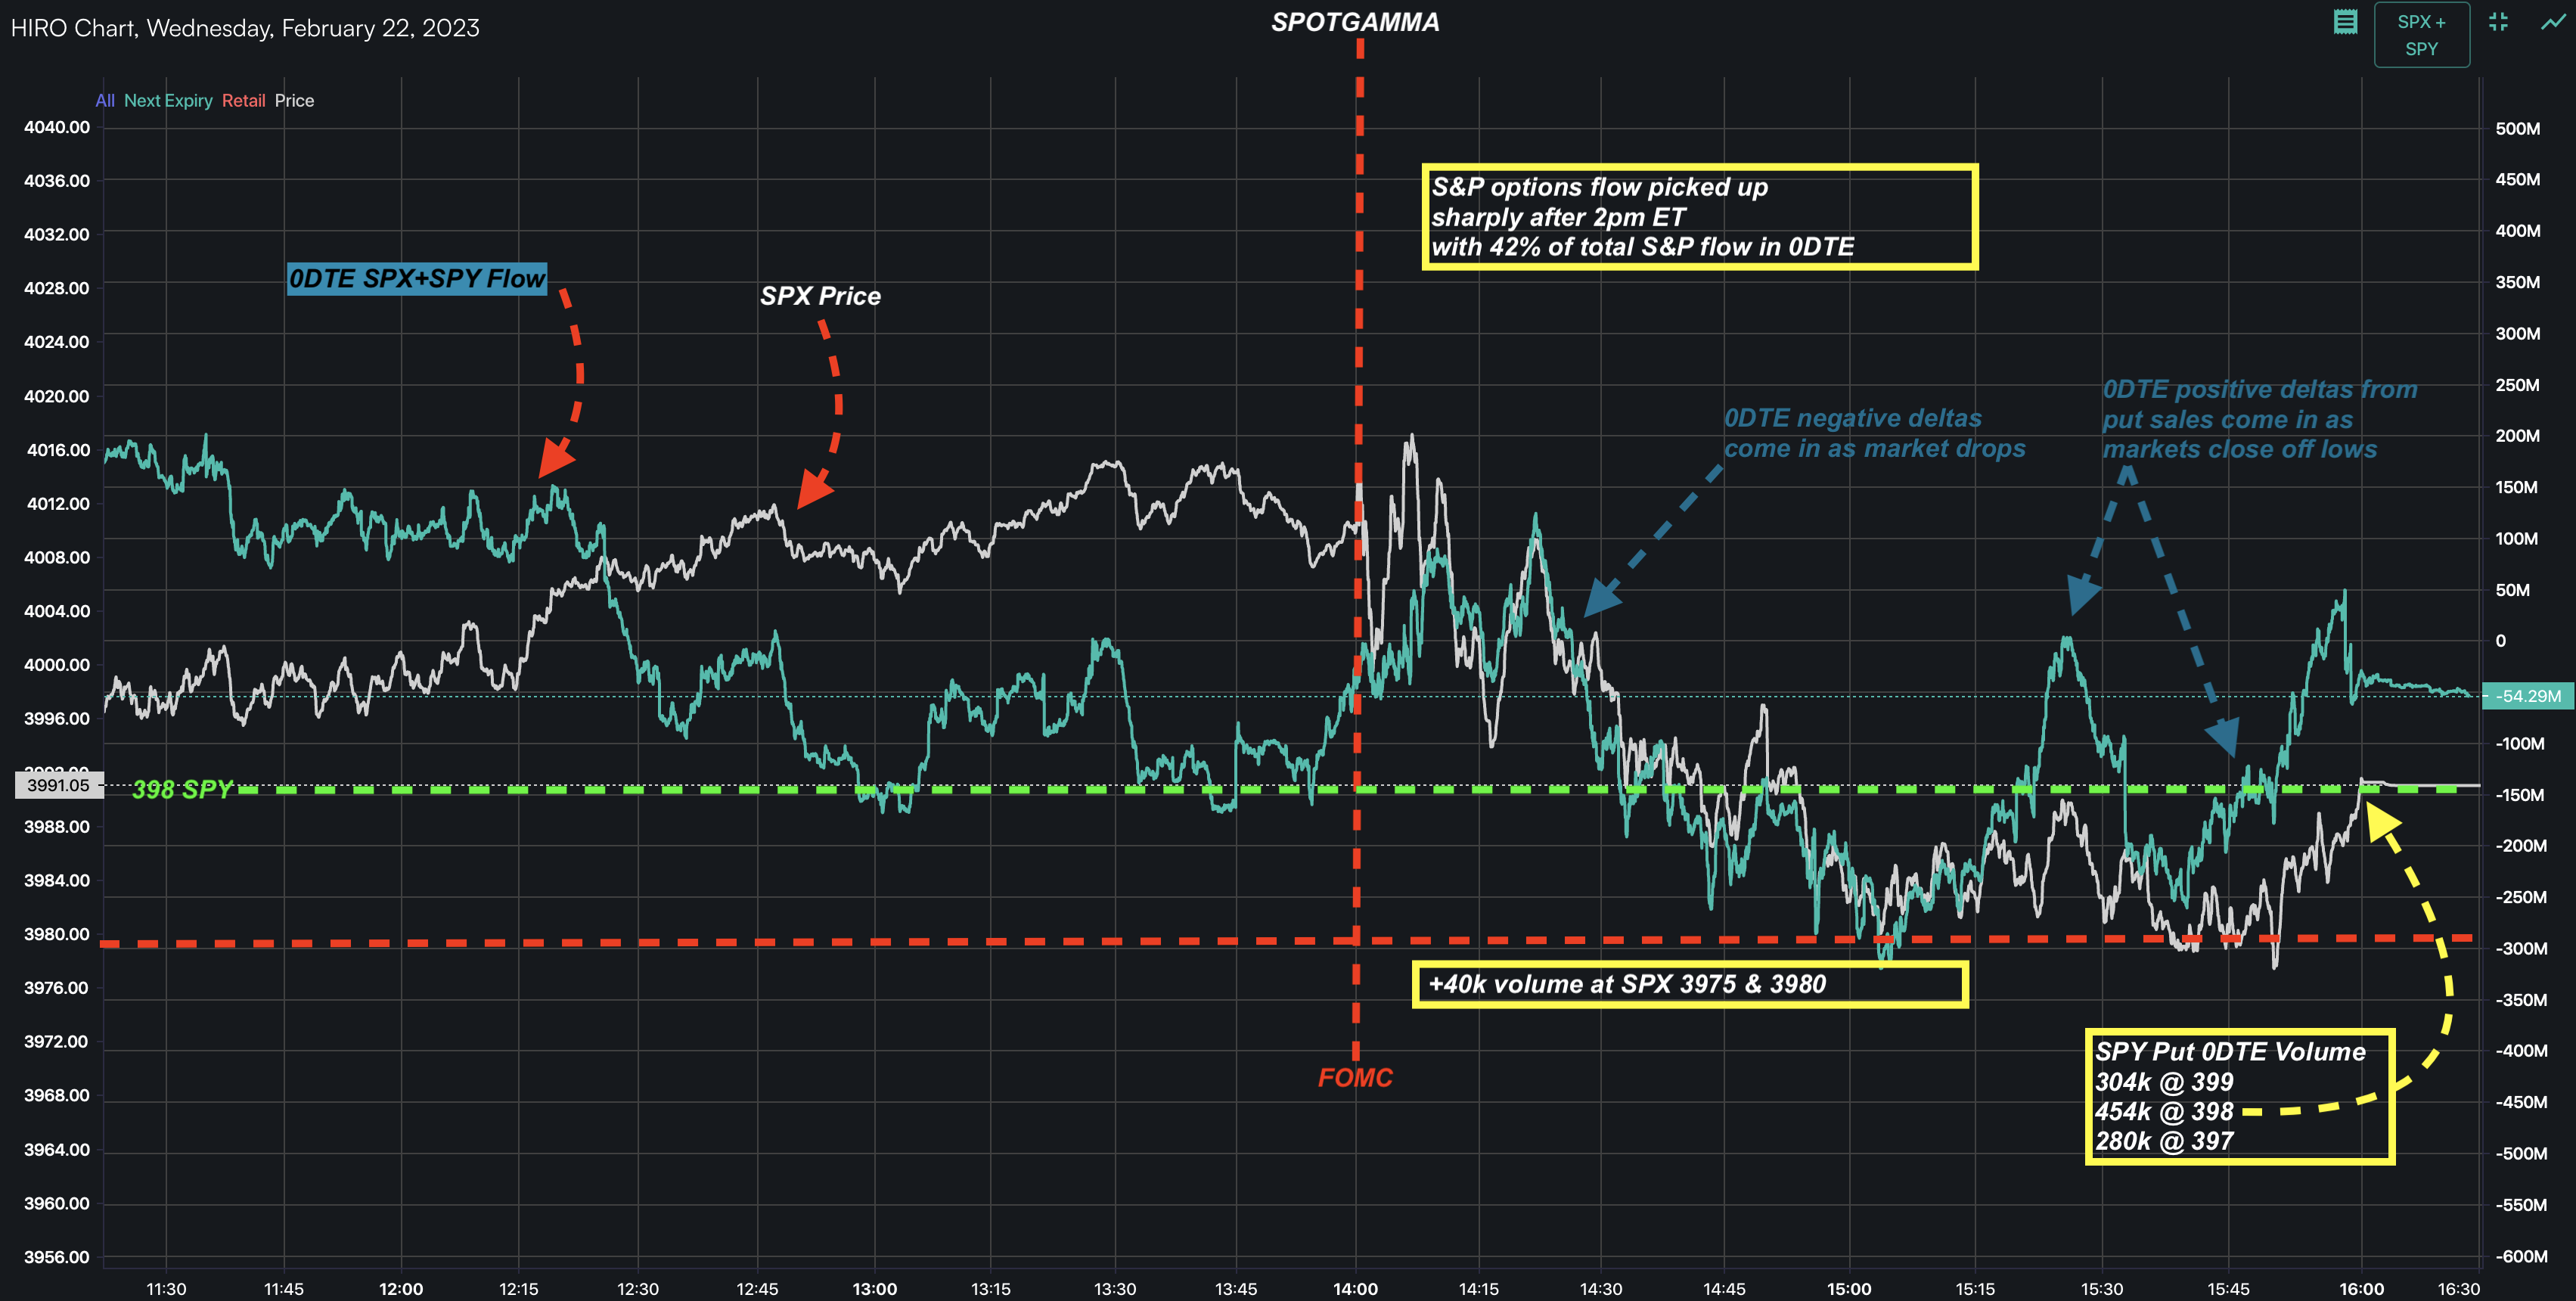
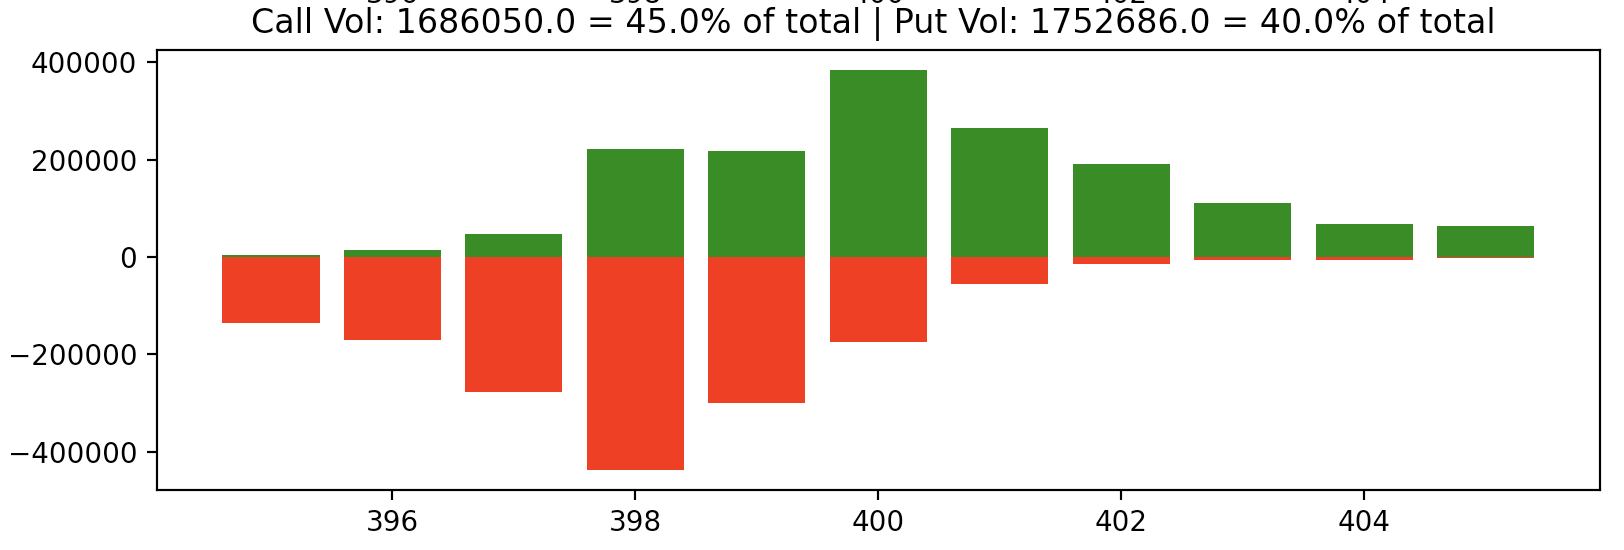
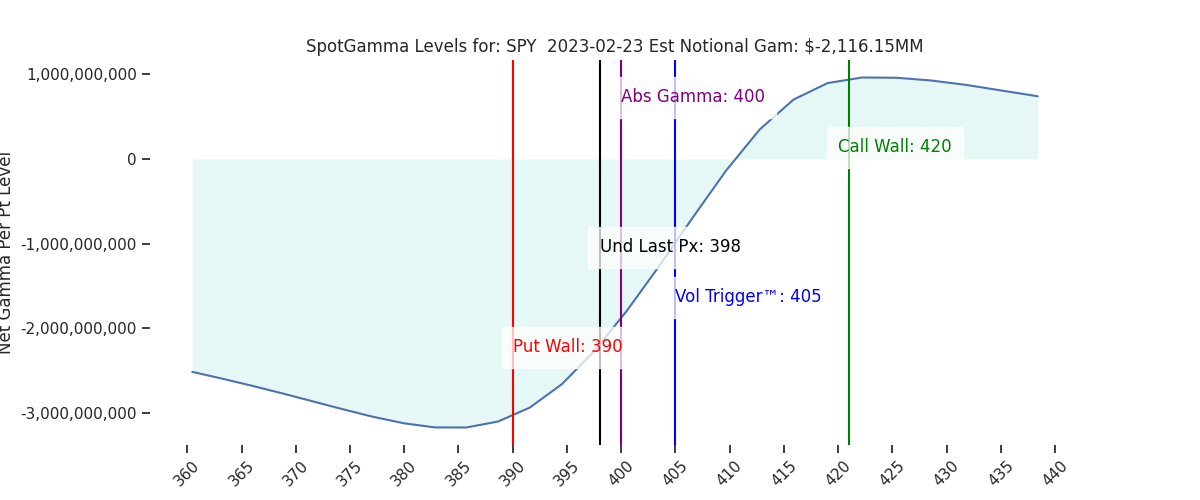
Whats significant about these figures (SPX 3980 & SPY 398) is that they are the two highest volume 0DTE strikes. Shown below is SPY 0DTE volume by strike. SPY 380 was the largest volume strike with over 450k puts traded yesterday, along with 200k 398 calls. Added to this were 300k each of 397 & 399 strike puts.
In SPX there were 45k of the 3980 puts traded, along with +35k at 3970 & 3975 – these strikes correspond with SPX lows on the session. The bottom line here is that with the FOMC mins proving uneventful, large ultra shorted dated flows came in to create some afternoon noise.

Turning to today, we’ve broadly been looking for this pivot point wherein the baton of options flows shifts from ultra short 0DTE gamma to longer dated vega, and had 4000 marked as the line of demarcation. Additionally we had been on the lookout for the OPEX drive price consolidation that was at hand over the past several sessions which staged the market at this 4000 demarkation line.
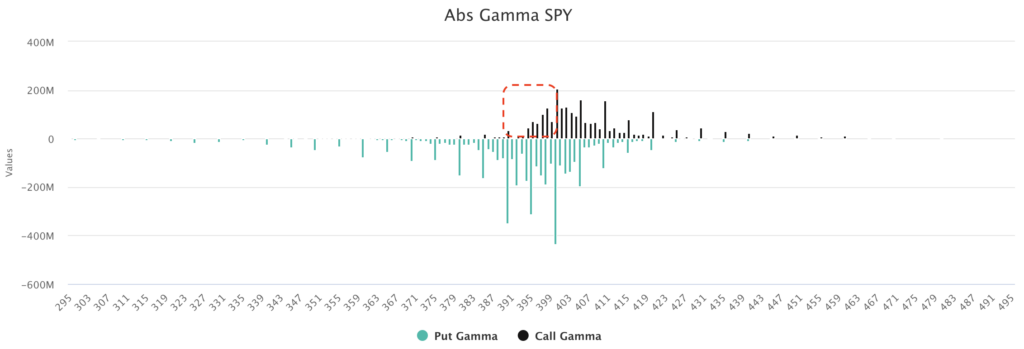
However, as markets have staged lower post-OPEX, we are now seeing positions fill in from the 395/3950-400/4000 range (compare to Mondays chart where under 400 there are no calls). This likely makes the 3950-4000 area a bit “stickier” which coincides with the aforementioned support levels around 3975 & 3950. This speaks to higher odds of the next level lower as being “a grind” vs violent swing. This is sort of shades of 2022 wherein markets moved lower without a major vol response.
Further to this point, the most notable aspect from the current volatility landscape is the shift lower of IV into today, after that benign FOMC release. If markets were geared up for risk post-FOMC mins and a big break of 4000 we would most certainly see the IV surface higher. Attention now immediately flips to the next data drop on Friday, and while IV is high for Friday it is ultimately in “fearless” contango.
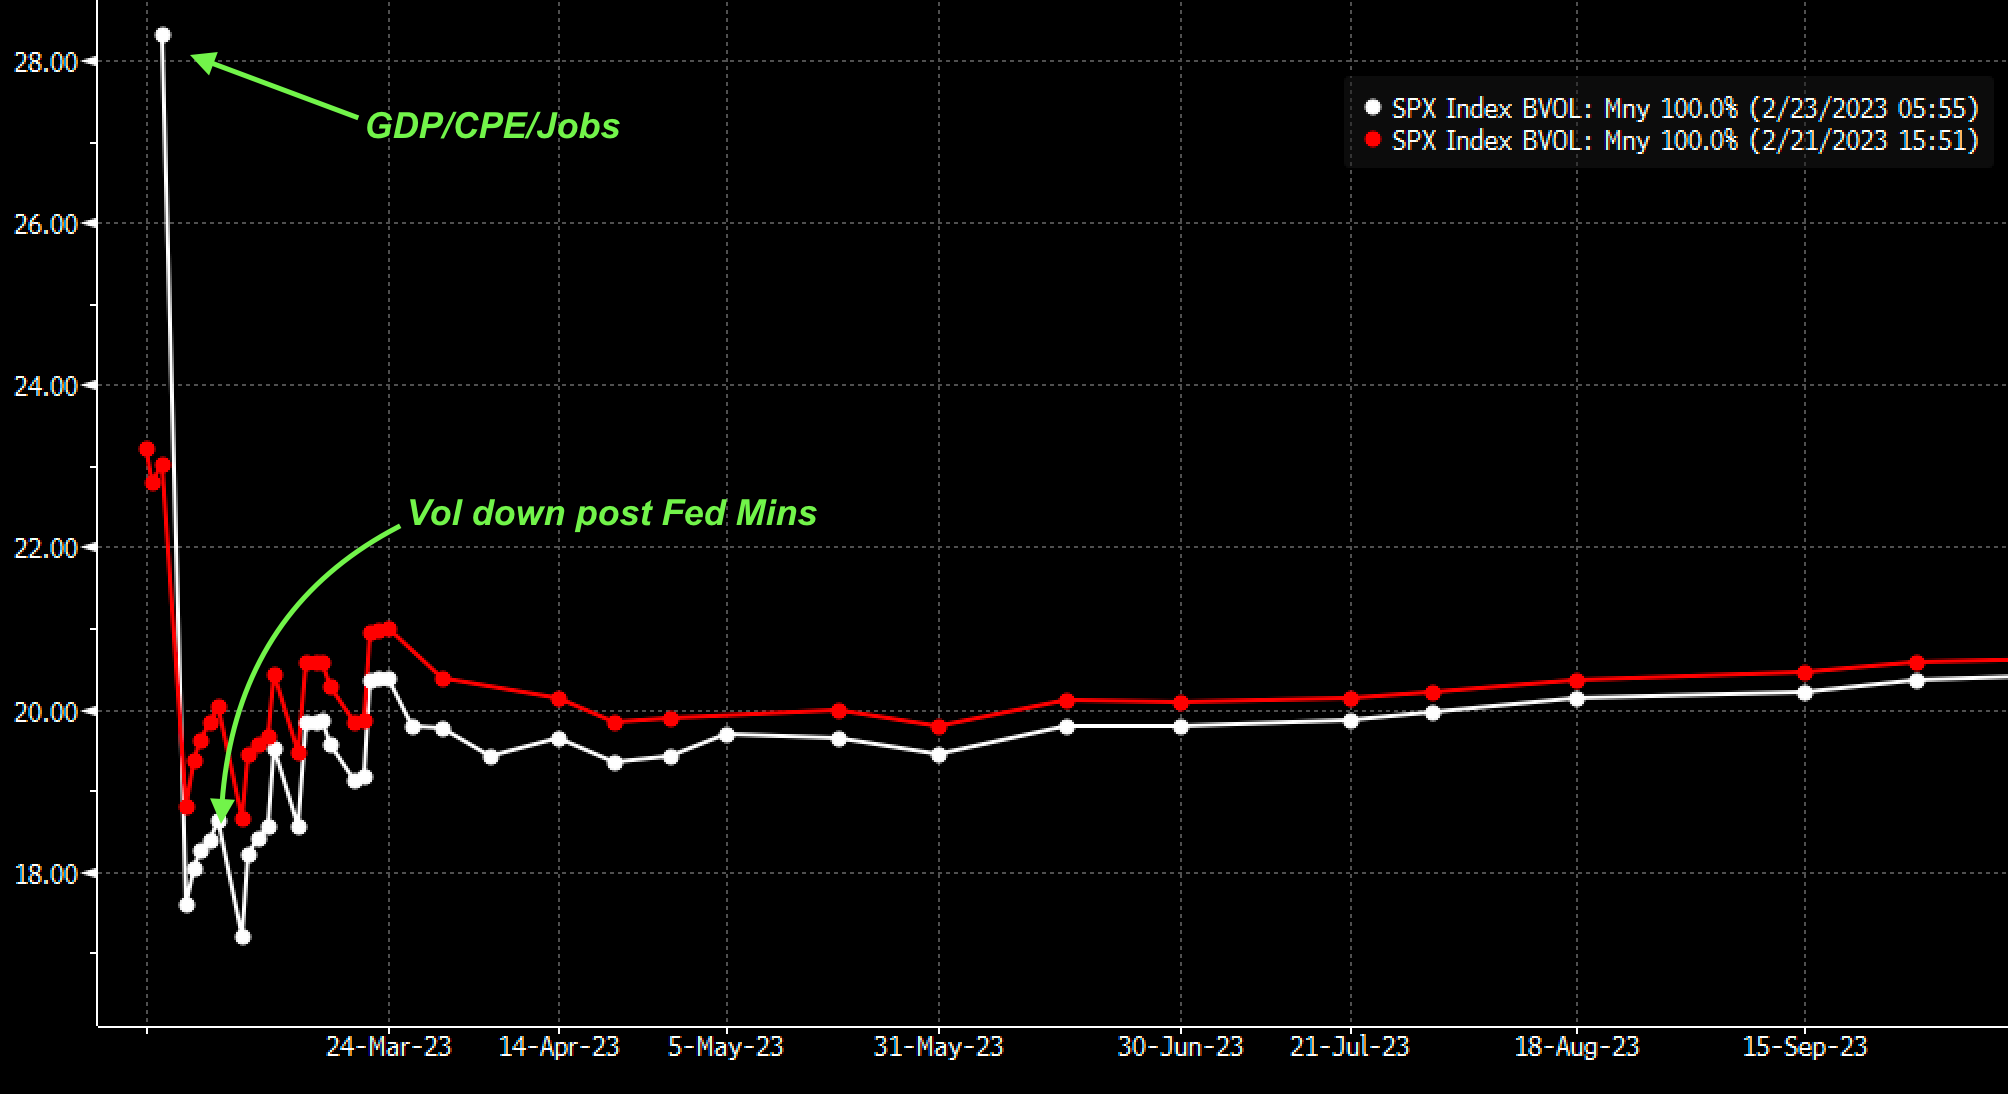
Ultimately “Long vol” seems to be the short term pain trade here as positions have filled in below. If Fridays prints come in anywhere near expectations, it likely closes this post-OPEX “window of weakness”. This is because one has to assume that in-line data leads to a reduction in IV which, in combination with 4000 holding (the biggest gamma line is currently support, not resistance), implies and upside move for markets.
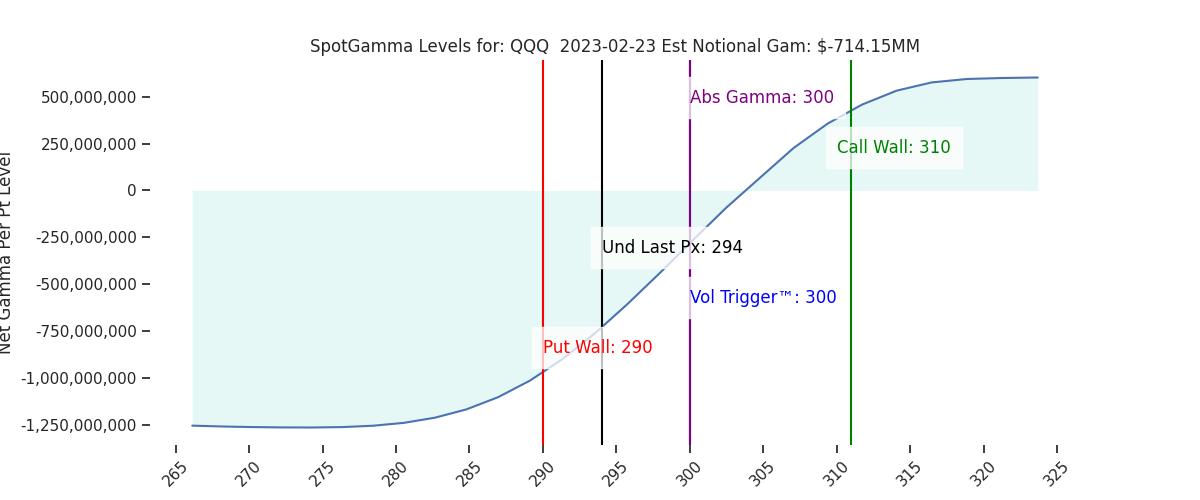
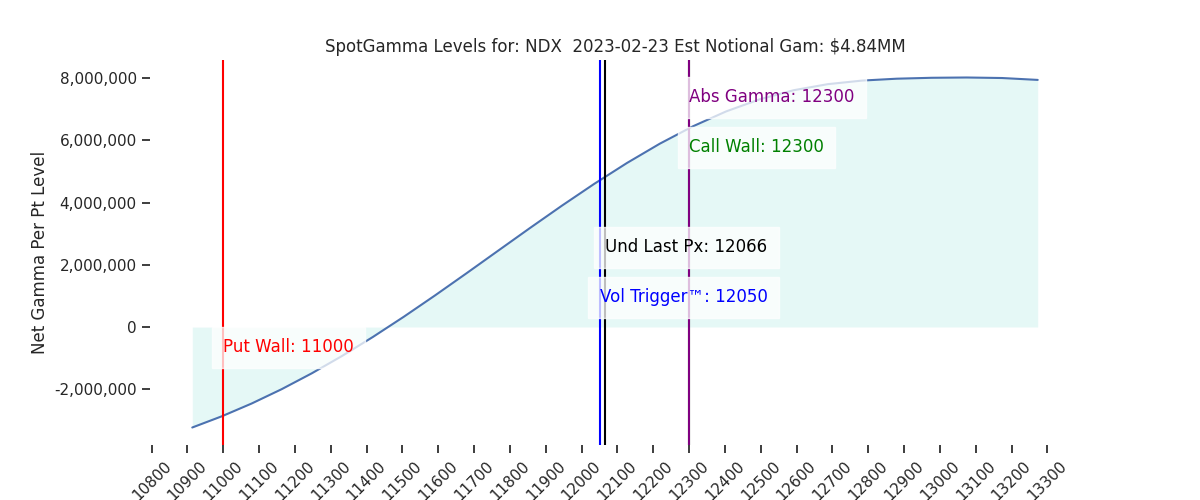
| SpotGamma Proprietary SPX Levels | Latest Data | SPX Previous | SPY | NDX | QQQ |
|---|---|---|---|---|---|
| Ref Price: | 3991 | 3991 | 398 | 12066 | 294 |
| SG Implied 1-Day Move:: | 0.97%, | (±pts): 39.0 | VIX 1 Day Impl. Move:1.41% | ||
| SG Implied 5-Day Move: | 2.33% | 4078 (Monday Ref Price) | Range: 3984.0 | 4174.0 | ||
| SpotGamma Gamma Index™: | -0.80 | -0.92 | -0.44 | 0.04 | -0.11 |
| Volatility Trigger™: | 4025 | 4025 | 405 | 12050 | 300 |
| SpotGamma Absolute Gamma Strike: | 4000 | 4000 | 400 | 12300 | 300 |
| Gamma Notional(MM): | -606.0 | -678.0 | -2116.0 | 5.0 | -714.0 |
| Put Wall: | 3900 | 3900 | 390 | 11000 | 290 |
| Call Wall : | 4200 | 4200 | 420 | 12300 | 310 |
| Additional Key Levels | Latest Data | Previous | SPY | NDX | QQQ |
|---|---|---|---|---|---|
| Zero Gamma Level: | 4069 | 4069 | 410.0 | 11428.0 | 312 |
| CP Gam Tilt: | 0.83 | 0.72 | 0.55 | 1.41 | 0.64 |
| Delta Neutral Px: | 3988 | ||||
| Net Delta(MM): | $1,499,048 | $1,499,470 | $181,760 | $47,387 | $96,925 |
| 25D Risk Reversal | -0.06 | -0.06 | -0.06 | -0.05 | -0.06 |
| Call Volume | 437,810 | 622,223 | 2,136,852 | 8,056 | 625,545 |
| Put Volume | 828,981 | 936,007 | 2,723,747 | 6,212 | 1,033,756 |
| Call Open Interest | 5,871,430 | 5,819,999 | 6,173,361 | 60,690 | 4,710,578 |
| Put Open Interest | 10,620,821 | 10,554,339 | 12,429,418 | 57,992 | 8,109,242 |
| Key Support & Resistance Strikes: |
|---|
| SPX: [4050, 4000, 3950, 3900] |
| SPY: [405, 400, 395, 390] |
| QQQ: [300, 295, 290, 280] |
| NDX:[13000, 12300, 12000, 11500] |
| SPX Combo (strike, %ile): [(4175.0, 78.87), (4151.0, 84.96), (4099.0, 84.3), (4075.0, 76.74), (4067.0, 88.75), (4031.0, 81.68), (4003.0, 80.71), (4000.0, 90.79), (3976.0, 86.86), (3956.0, 88.76), (3952.0, 95.79), (3944.0, 76.54), (3924.0, 91.61), (3904.0, 92.35), (3900.0, 96.62), (3884.0, 75.36), (3876.0, 83.51), (3856.0, 84.97), (3852.0, 89.33), (3824.0, 76.48), (3800.0, 95.58)] |
| SPY Combo: [389.37, 394.55, 379.41, 389.77, 391.76] |
| NDX Combo: [12296.0, 11897.0, 11692.0, 11487.0, 11970.0] |
0 comentarios