
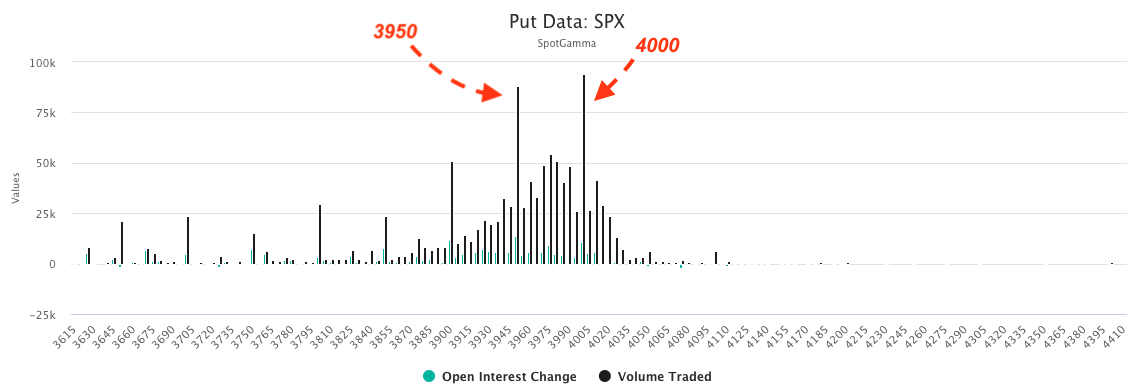
Futures have contracted back to the 4000 level. Critical support below lies at the 3950 Put Wall, and a break of that level suggests a rapid test of the 3900 level. Resistance above remains at 4020, followed by 4050. The 4000-4010 (SPY400) area remains the large pin/pivot line.
There were very large volumes at 3950 & 4000 put strikes yesterday. This led to a ~10k OI increase at these strikes, but the volume speaks more to the activity taking place in this 3950-4000 range and the “grind lower” idea we discussed yesterday AM. The core idea being we were on the lookout for 4000 being this “volatility release point”, but volumes and positions filled in from 3950-4000, which lowered our “release point” to 3950.
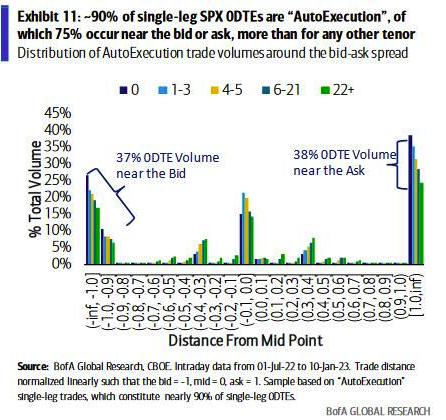
On this same line of thought, we again saw 0DTE long put/call buyers initiating intraday swings (video here), with IV relatively unresponsive. Its somewhat like 0DTE starts these small fires each day, and then puts them out later in the day. To this point BOFA sees 0DTE trading at the ask (buyers) in the AM, and bid (sellers) in the PM.
In theory these 3950-4000 positions should help add a support base under the market and had us looking for a short term market bounce. This idea was additionally based on the idea that if this weeks data points were largely non-events, then IV/vanna would add a bullish tailwind.
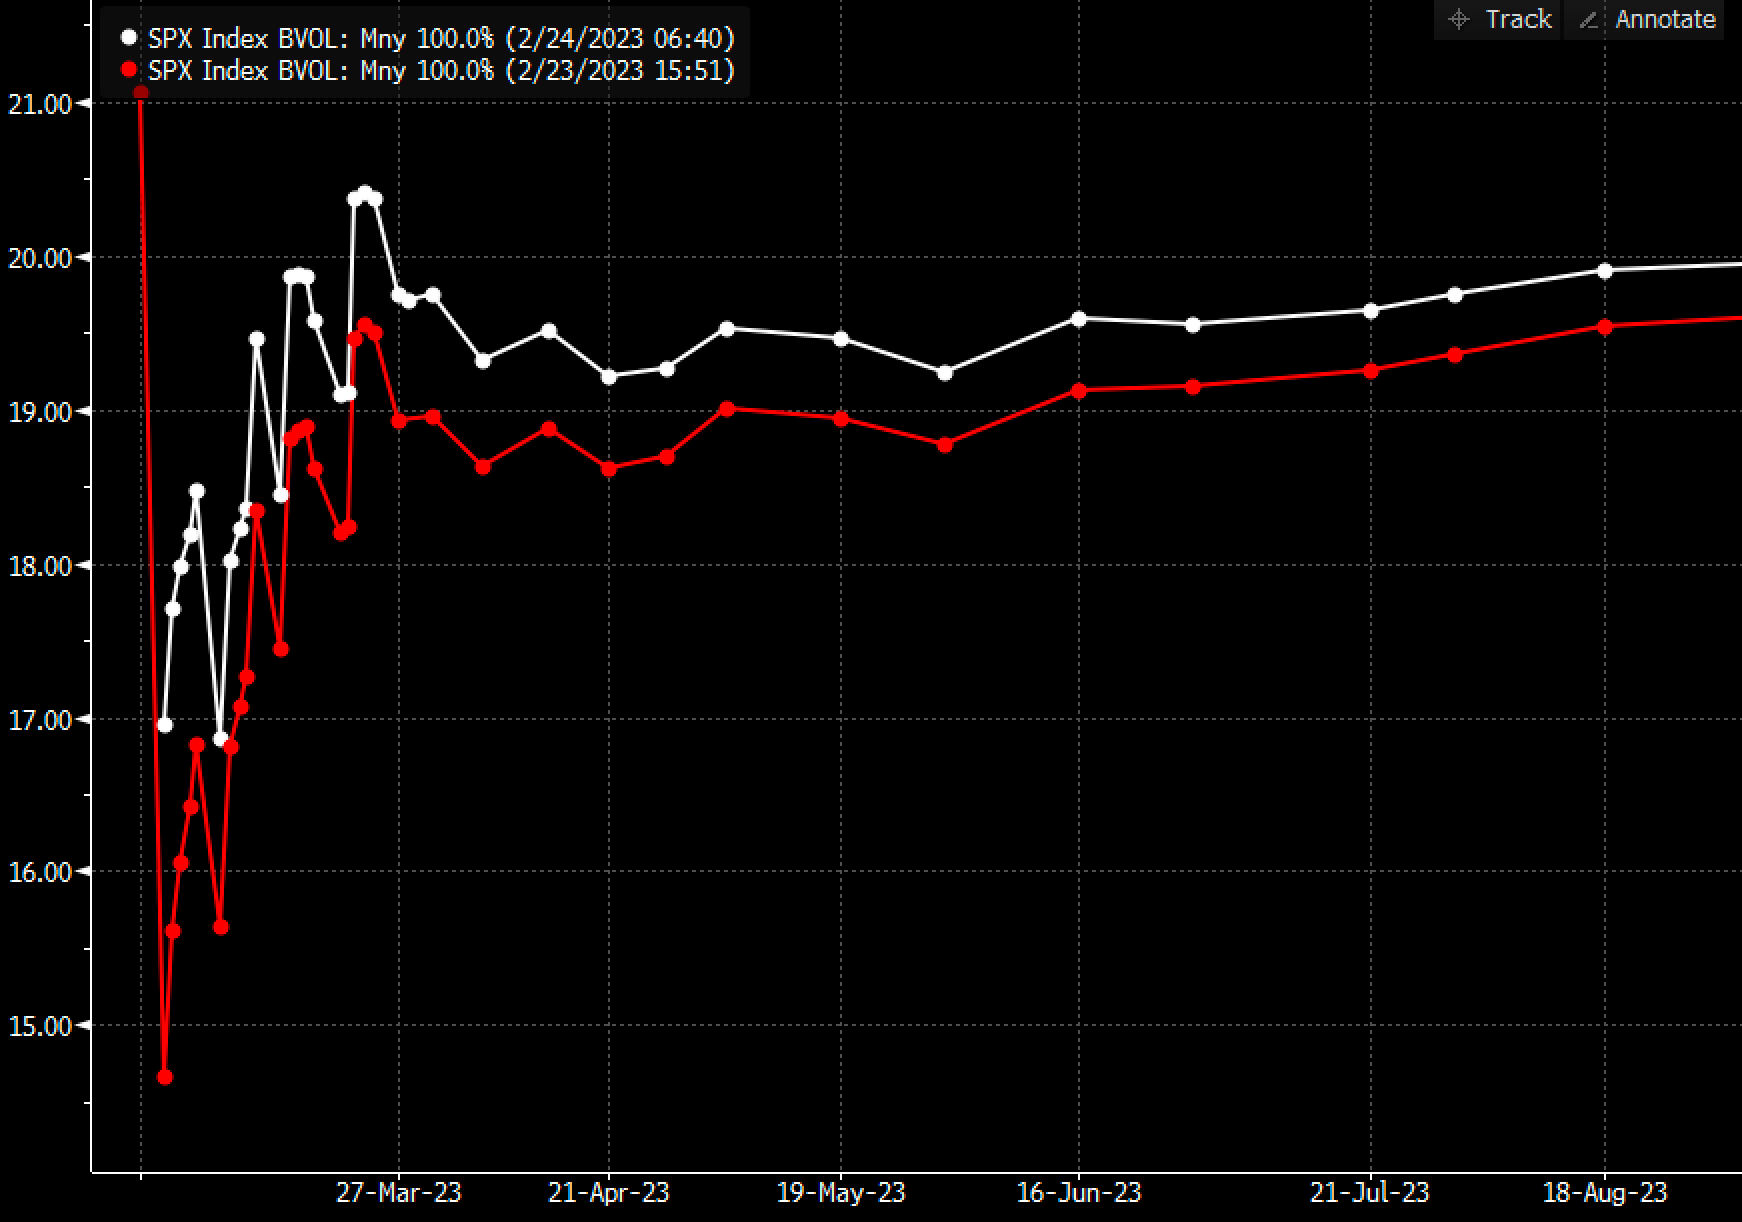
If we look at updated SPX term structure, you can see a clear contango and no elevated “0DTE” IV for todays PCE numbers (red = yesterday, white = today). In most circumstances this would be considered/perceived a fairly low risk environment. Despite this, futures are under a bit of pressure this morning – which is again shades of ’22 “IV is lagging equity declines”.
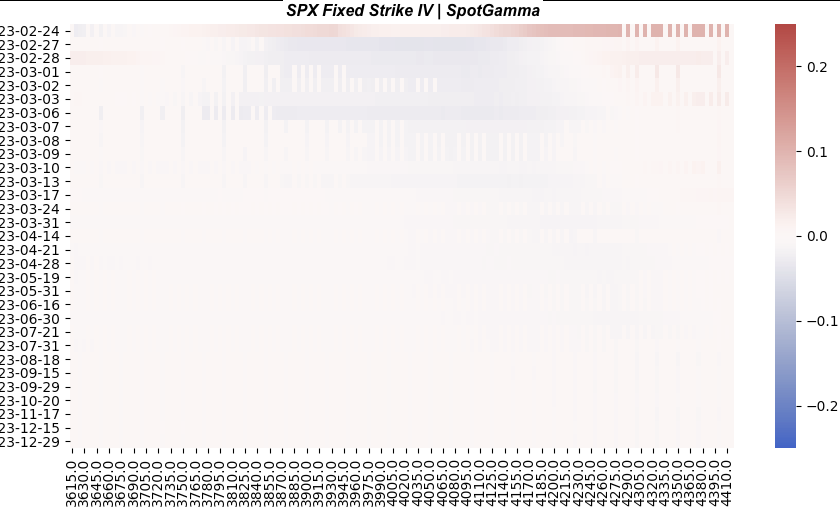
You see a similar, lower IV through fixed strike readings. Here, the shades of blue suggest a decompression of implied volatility. Long downside hedges are apparently not in demand.
While IV is fairly unresponsive here, what we are concerned with is jump risk. 0DTE seems to be locally controlling volatility as larger, longer dated market forces are unprovoked. As discussed several times recently, we feel there is this trigger point where the ultra short dated “gamma games” give way to larger, long dated vega and markets/IV pop meaningfully lower/higher. While we were marking this as the 4000 level, we had to update that risk level to 3950 yesterday as positions filled in.
What we are ultimately trying to identify is this idea of a “liquidity hole”. Through our lens, it is the area wherein vega/convexity is inflamed, and the resulting hedges dunk markets. While we do not have a great reason for markets to probe into this area <3950 (given the passing of data prints & lower IV), we must acknowledge what we see as a lurking risk.
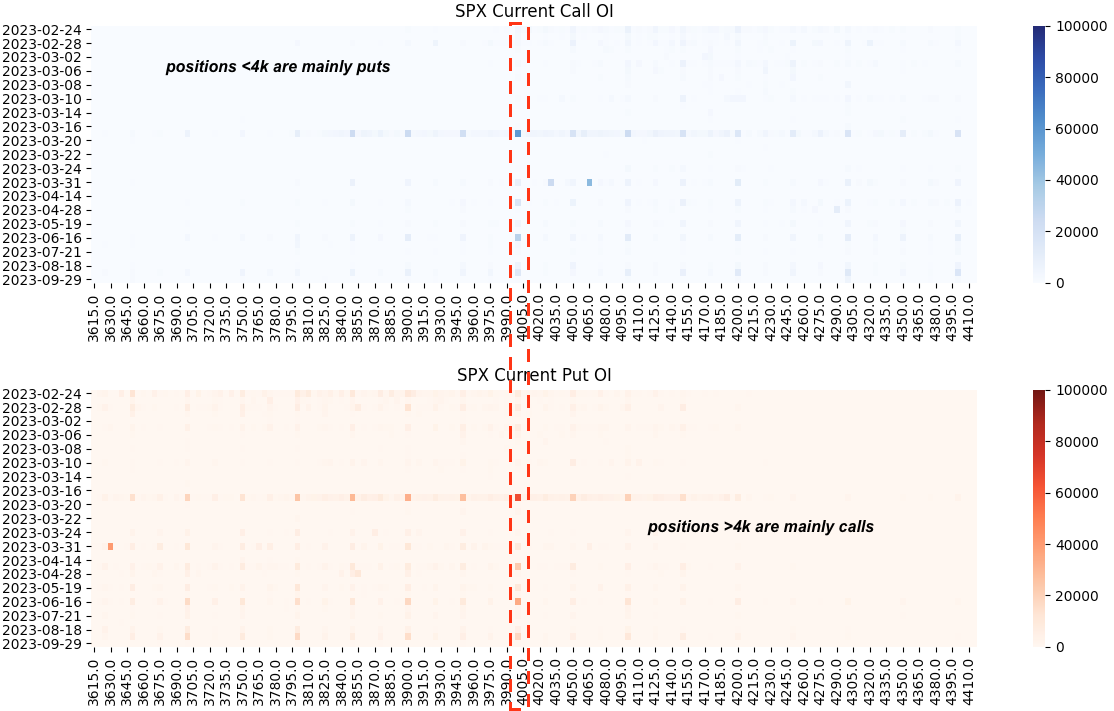
This risk is more pertinent under 4k because of positioning. In addition to the very high VIX call interest, its below 4000 where the positioning is predominantly puts. Here we have posted raw open interest for the SPX, and you can see the difference between calls and puts ±4000. We don’t see this as the stuff that “limit down” markets are made of, but those quick multi-day downdrafts as seen in June or Sep of ’22 (and both of those sold into quarterly OPEX, like what we have in March).
| SpotGamma Proprietary SPX Levels | Latest Data | SPX Previous | SPY | NDX | QQQ |
|---|---|---|---|---|---|
| Ref Price: | 4012 | 4009 | 400 | 12180 | 296 |
| SG Implied 1-Day Move:: | 0.95%, | (±pts): 38.0 | VIX 1 Day Impl. Move:1.33% | ||
| SG Implied 5-Day Move: | 2.33% | 4078 (Monday Ref Price) | Range: 3984.0 | 4174.0 | ||
| SpotGamma Gamma Index™: | -0.53 | -0.81 | -0.37 | 0.04 | -0.09 |
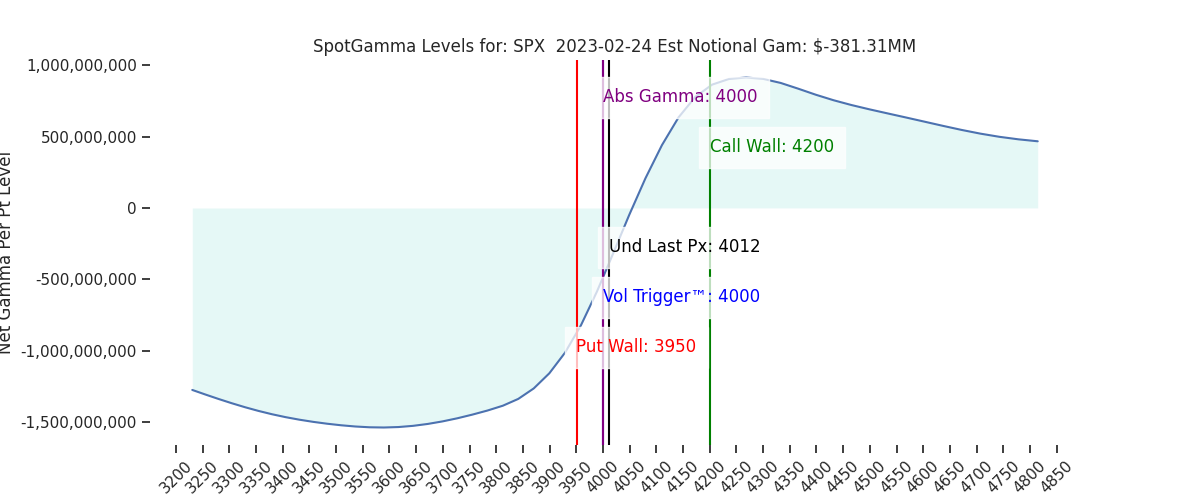
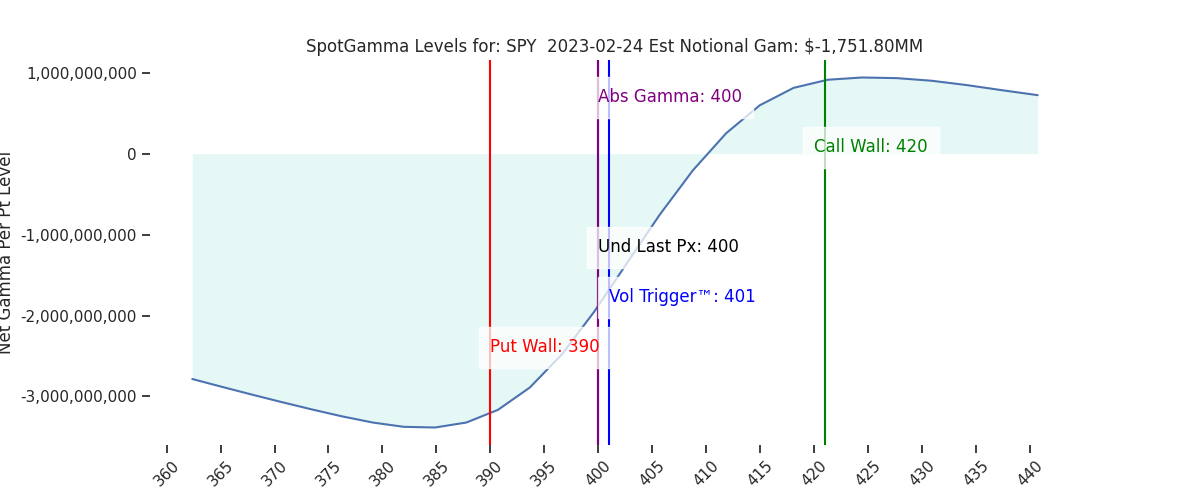
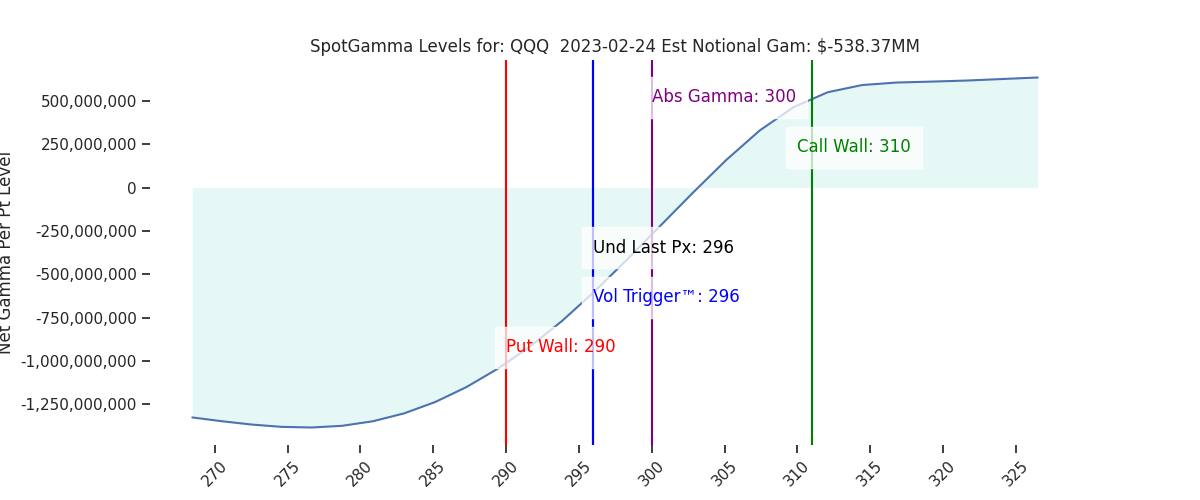
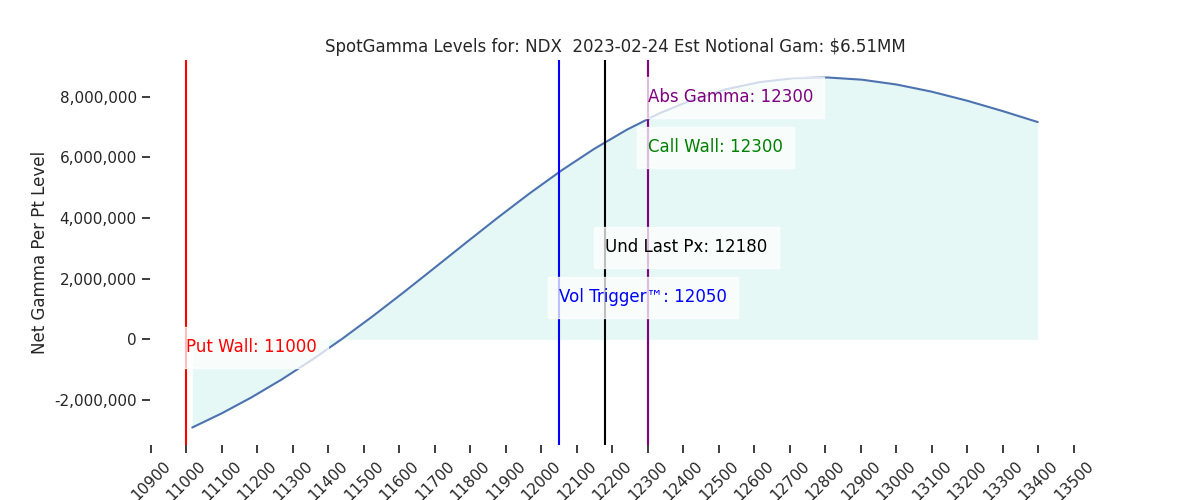
| Volatility Trigger™: | 4000 | 4025 | 401 | 12050 | 296 |
| SpotGamma Absolute Gamma Strike: | 4000 | 4000 | 400 | 12300 | 300 |
| Gamma Notional(MM): | -381.0 | -458.0 | -1752.0 | 7.0 | -538.0 |
| Put Wall: | 3950 | 3900 | 390 | 11000 | 290 |
| Call Wall : | 4200 | 4200 | 420 | 12300 | 310 |
| Additional Key Levels | Latest Data | Previous | SPY | NDX | QQQ |
|---|---|---|---|---|---|
| Zero Gamma Level: | 4059 | 4057 | 409.0 | 11363.0 | 313 |
| CP Gam Tilt: | 0.89 | 0.8 | 0.63 | 1.54 | 0.73 |
| Delta Neutral Px: | 4009 | ||||
| Net Delta(MM): | $1,559,878 | $1,505,913 | $181,615 | $50,939 | $96,922 |
| 25D Risk Reversal | -0.06 | -0.06 | -0.07 | -0.06 | -0.07 |
| Call Volume | 533,527 | 437,810 | 2,431,428 | 7,862 | 727,232 |
| Put Volume | 971,082 | 828,981 | 3,011,001 | 9,570 | 1,124,167 |
| Call Open Interest | 5,878,544 | 5,871,430 | 6,300,851 | 61,543 | 4,812,378 |
| Put Open Interest | 11,038,383 | 10,620,821 | 12,899,747 | 60,694 | 8,271,647 |
| Key Support & Resistance Strikes: |
|---|
| SPX: [4100, 4050, 4000, 3900] |
| SPY: [405, 400, 395, 390] |
| QQQ: [300, 295, 290, 280] |
| NDX:[13000, 12300, 12000, 11500] |
| SPX Combo (strike, %ile): [(4201.0, 92.76), (4177.0, 80.35), (4149.0, 85.38), (4100.0, 83.69), (4076.0, 78.51), (4064.0, 91.72), (4028.0, 84.42), (4004.0, 81.34), (4000.0, 94.37), (3976.0, 87.56), (3956.0, 86.99), (3948.0, 96.92), (3924.0, 91.5), (3904.0, 90.62), (3900.0, 96.71), (3876.0, 80.07), (3856.0, 82.91), (3852.0, 89.76), (3824.0, 77.21)] |
| SPY Combo: [394.25, 389.44, 399.46, 419.49, 405.87] |
| NDX Combo: [12302.0, 11900.0, 11693.0, 11985.0, 12716.0] |
0 comentarios