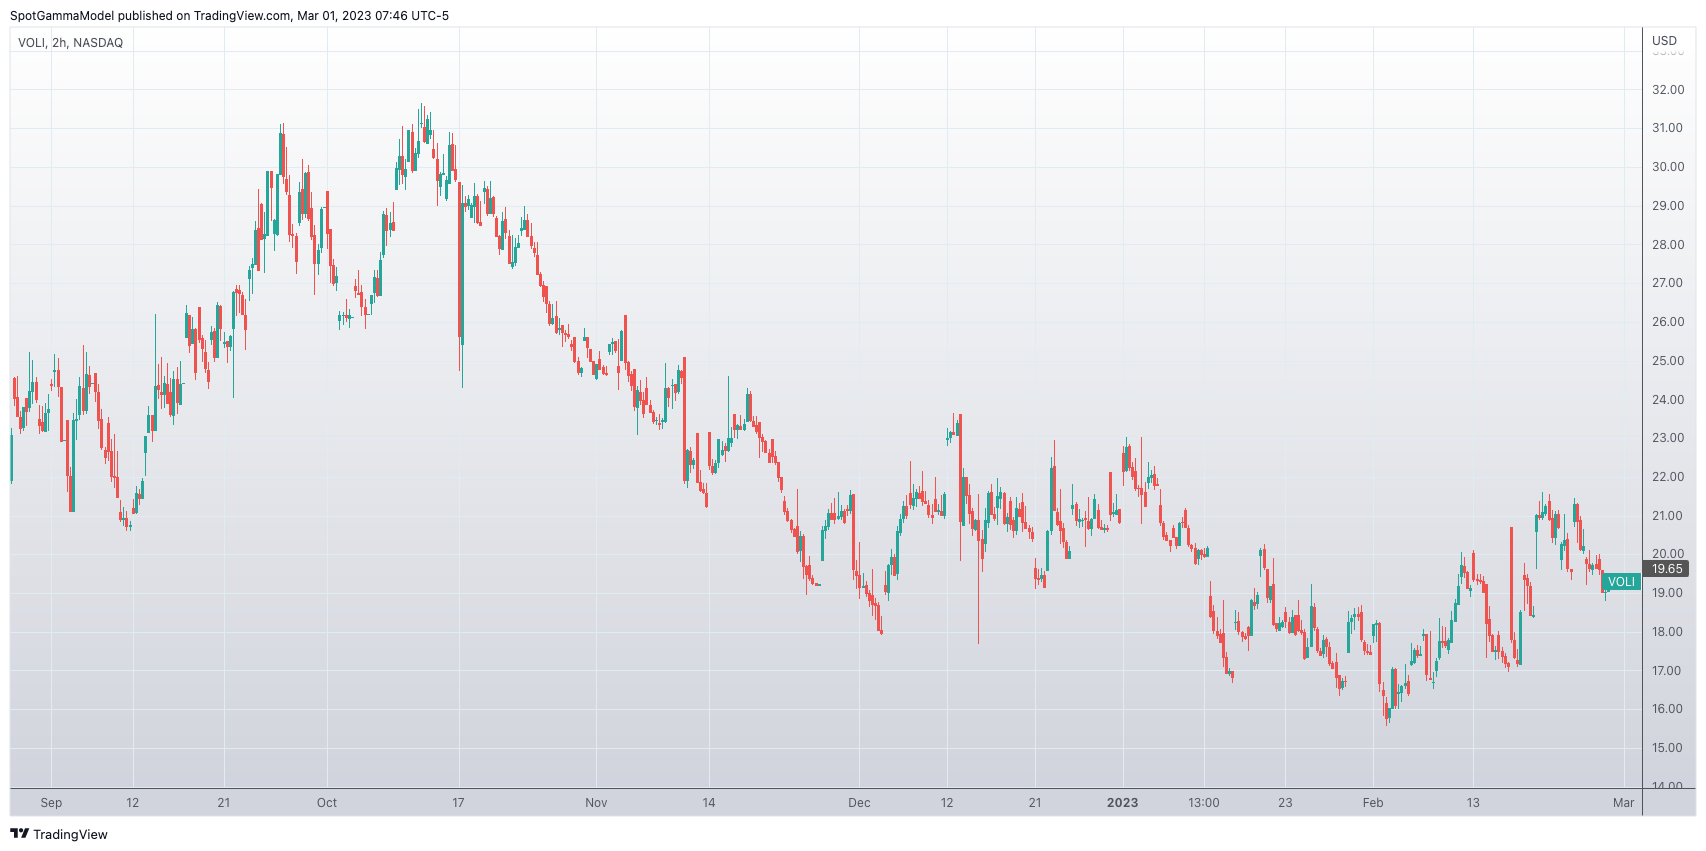
While the S&P continues to revolve around 4000, it seems to favor probes lower. However, away from the short dated gyrations, longer dated implied volatility continues to remain unprovoked, as shown by the VOLI index (30 day SPY ATM IV). Traders are not worried.
While yesterday we touched again on this idea of “liquidity holes” and large gaps lower, we think that markets would have to stage down toward 3900-3950 before that jump risk is truly elevated.
What we are really on alert for here is a trend to pop its head out. On one side the inability to break above 4000 should inevitably meet lower implied volatility, which should be a boost for equity prices and eventually lead to a break higher.
To the downside, the “grind down” scenario seems equally probably as well. The issue with the downside is that its being stuffed with 0DTE, and unresponsive IV. This slows market movement to the downside, until we hit an IV release points (currently 3900) where short dated gamma gives way to vega.
Its very challenging to find an edge here, and it may be that we need new data to finally push the S&P to one side of the 4000 equilibrium.
What should help reinforce trend is the large March options expiration that is now ~2 weeks out. As the S&P tips toward one direction, the large options positions for March expiration should gain in value, which should in turn initiate negative hedging flows that continue directional momentum.
Said more simply: we are looking for a strong directional move starting in the next several days that continues into March 17th.

| SpotGamma Proprietary SPX Levels | Latest Data | SPX Previous | SPY | NDX | QQQ |
|---|---|---|---|---|---|
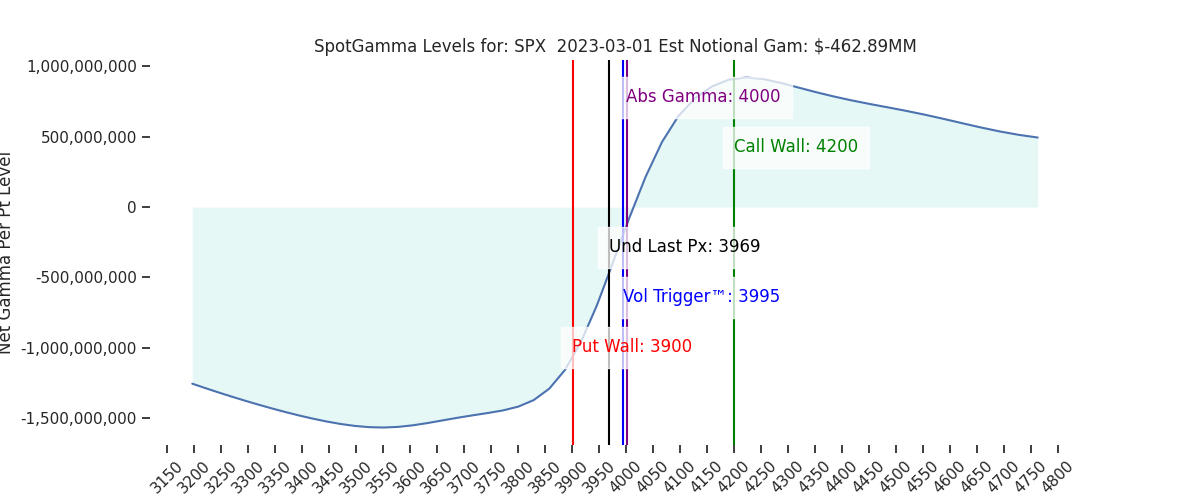
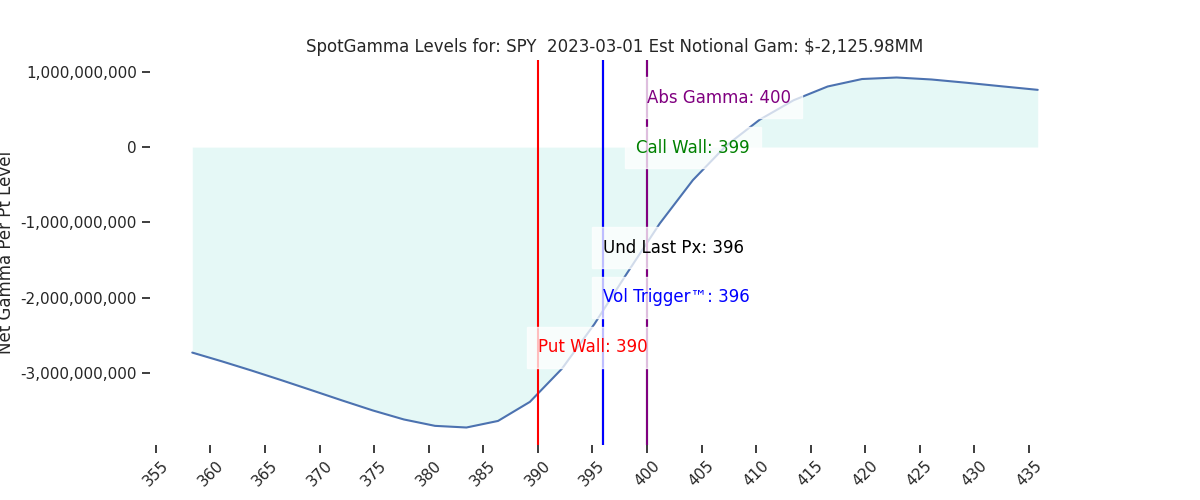
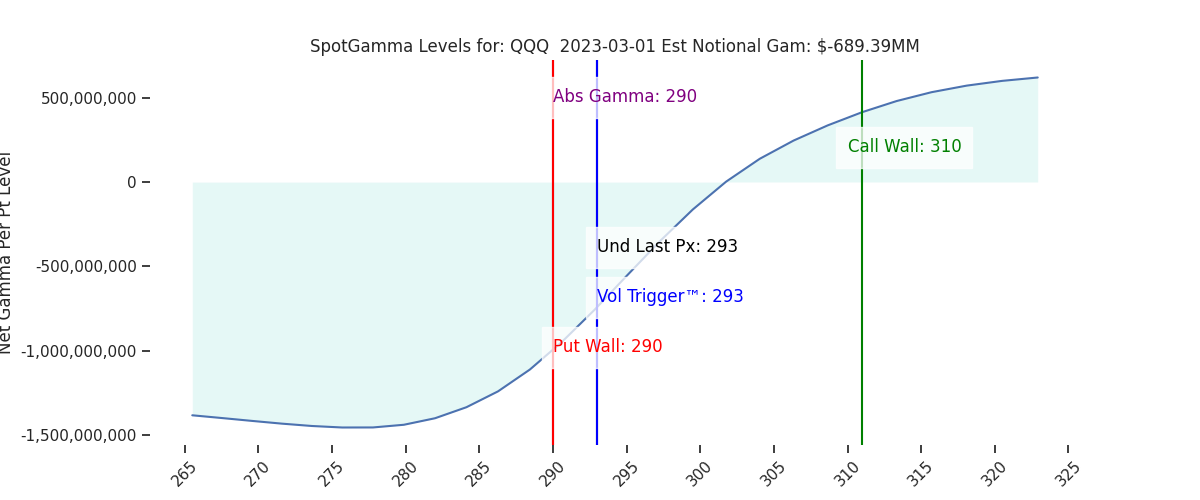
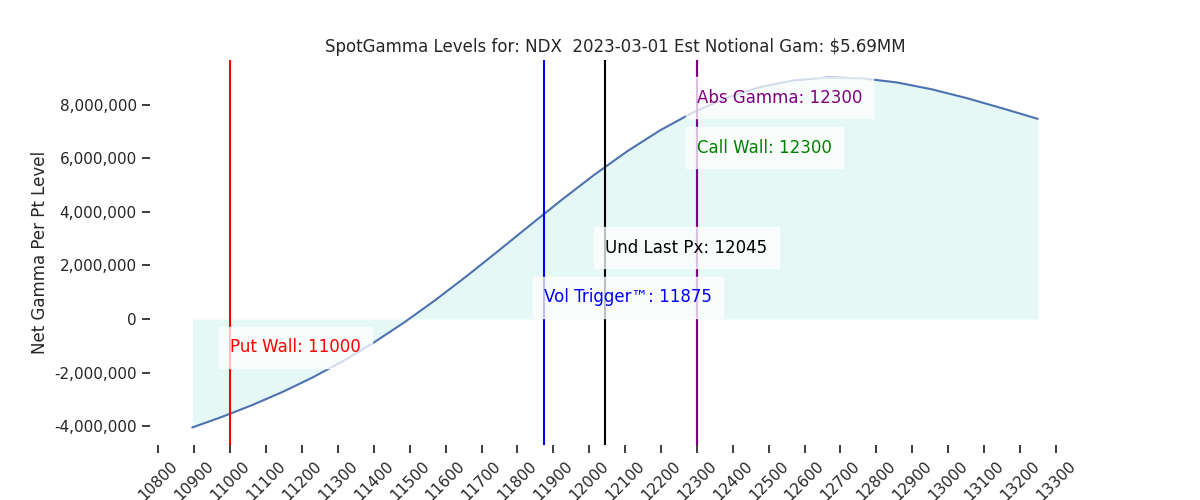
| Ref Price: | 3969 | 3985 | 396 | 12045 | 293 |
| SG Implied 1-Day Move:: | 0.88%, | (±pts): 35.0 | VIX 1 Day Impl. Move:1.29% | ||
| SG Implied 5-Day Move: | 2.7% | 3970 (Monday Ref Price) | Range: 3863.0 | 4077.0 | ||
| SpotGamma Gamma Index™: | -0.92 | -0.61 | -0.44 | 0.03 | -0.10 |
| Volatility Trigger™: | 3995 | 4000 | 396 | 11875 | 293 |
| SpotGamma Absolute Gamma Strike: | 4000 | 4000 | 400 | 12300 | 290 |
| Gamma Notional(MM): | -463.0 | -476.0 | -2126.0 | 6.0 | -689.0 |
| Put Wall: | 3900 | 3900 | 390 | 11000 | 290 |
| Call Wall : | 4200 | 4200 | 399 | 12300 | 310 |
| Additional Key Levels | Latest Data | Previous | SPY | NDX | QQQ |
|---|---|---|---|---|---|
| Zero Gamma Level: | 4013 | 4029 | 404.0 | 11491.0 | 306 |
| CP Gam Tilt: | 0.81 | 0.81 | 0.57 | 1.43 | 0.67 |
| Delta Neutral Px: | 4026 | ||||
| Net Delta(MM): | $1,534,497 | $1,505,358 | $183,221 | $48,672 | $96,056 |
| 25D Risk Reversal | -0.06 | -0.06 | -0.06 | -0.06 | -0.06 |
| Call Volume | 546,550 | 524,498 | 1,817,651 | 7,990 | 595,569 |
| Put Volume | 875,783 | 918,962 | 2,340,397 | 6,894 | 832,625 |
| Call Open Interest | 5,951,626 | 6,055,070 | 6,350,943 | 60,808 | 4,786,014 |
| Put Open Interest | 11,035,950 | 10,835,726 | 13,028,019 | 62,970 | 8,374,298 |
| Key Support & Resistance Strikes: |
|---|
| SPX: [4100, 4000, 3950, 3900] |
| SPY: [400, 398, 395, 390] |
| QQQ: [300, 295, 290, 285] |
| NDX:[13000, 12300, 12000, 11500] |
| SPX Combo (strike, %ile): [(4148.0, 83.06), (4100.0, 79.38), (4065.0, 91.22), (4029.0, 79.92), (4025.0, 78.23), (3957.0, 87.11), (3949.0, 94.51), (3945.0, 78.38), (3938.0, 86.72), (3926.0, 93.76), (3918.0, 87.05), (3906.0, 92.5), (3898.0, 98.56), (3886.0, 79.72), (3874.0, 79.76), (3854.0, 84.29), (3850.0, 92.42), (3807.0, 79.88), (3799.0, 96.36)] |
| SPY Combo: [389.13, 379.22, 394.28, 391.9, 389.92] |
| NDX Combo: [12298.0, 11901.0, 11696.0, 11491.0, 11816.0] |