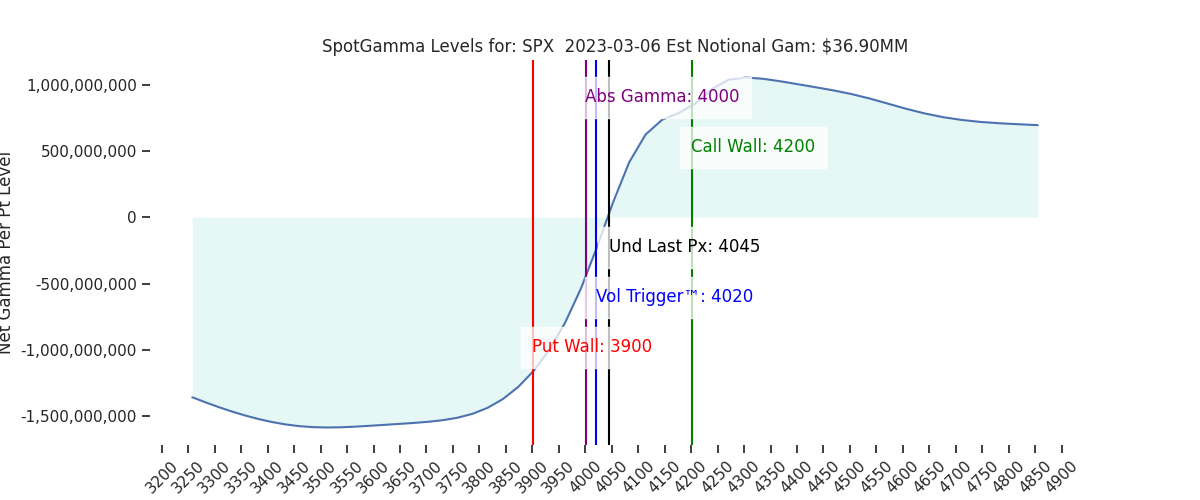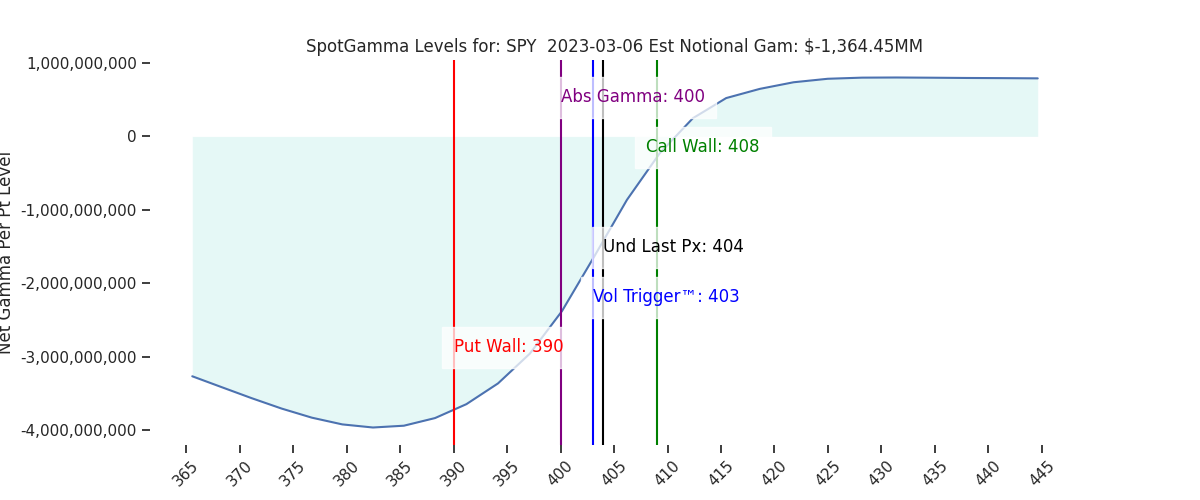
Futures are flat to Fridays close, near 4050. There is a band of resistance levels above at 4050, 4060(SPY 405), 4070 (SPY 408), then 4100. Support below shows at 4015 (SPY 400), then 4000. We anticipate relatively low volatility today (<1% move).
While Fridays strong price action did push through 402 SPY Call Wall resistance, the real test for buyers is at hand. We default to the view that the rally back into 4000 was essentially reversion to the mean, aided by a decline in IV (vanna). Coincidentally, the equity reversion and return to the 4000 equilibrium times with a key catalyst: Powell’s semi-annual Senate testimony (3/7 & 3/8).
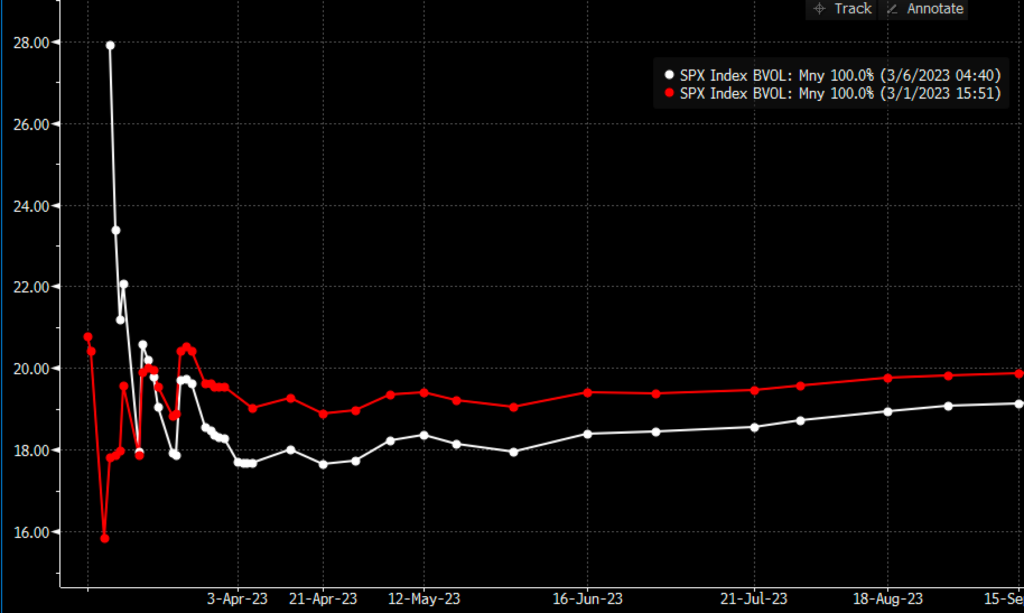
Looking back to last week, bears had every opportunity to grab the mantle, but were unable to generate momentum. As a result, while IV is a bit elevated for Powells testimony, SPX term structure is down from a week ago (below, red).
Further, other IV metrics like our Risk Reversal hold a distinctly “unconcerned” stance (-0.03). While normally we would state these IV readings as “bullish” we need to carefully distinguish the concepts of “not wanting to short” (and/or selling puts) vs “believing in major upside”.
To this point, in our data scans over the weekend we were looking at call positioning across total US equities + ETF’s + Index. After Jan OPEX there has been a major decline in call open interest, while put interest has remained stable. There are clearly many reasons for traders to be less bullish in this environment vs ’21, however there have been several bouts of record call volume towards early February. Clearly the low call interest lends to the idea that the record call volume was more tied to transient speculation vs a long term expression of bullishness.

When you look at this from a volume perspective, we can see that the call volume-put volume ratio has essentially stabilized back to the “pre covid” era. However, as quipped above, traders have learned since ’20 to flood into short dated call positions as a way to both speculate and hedge right tail risk.

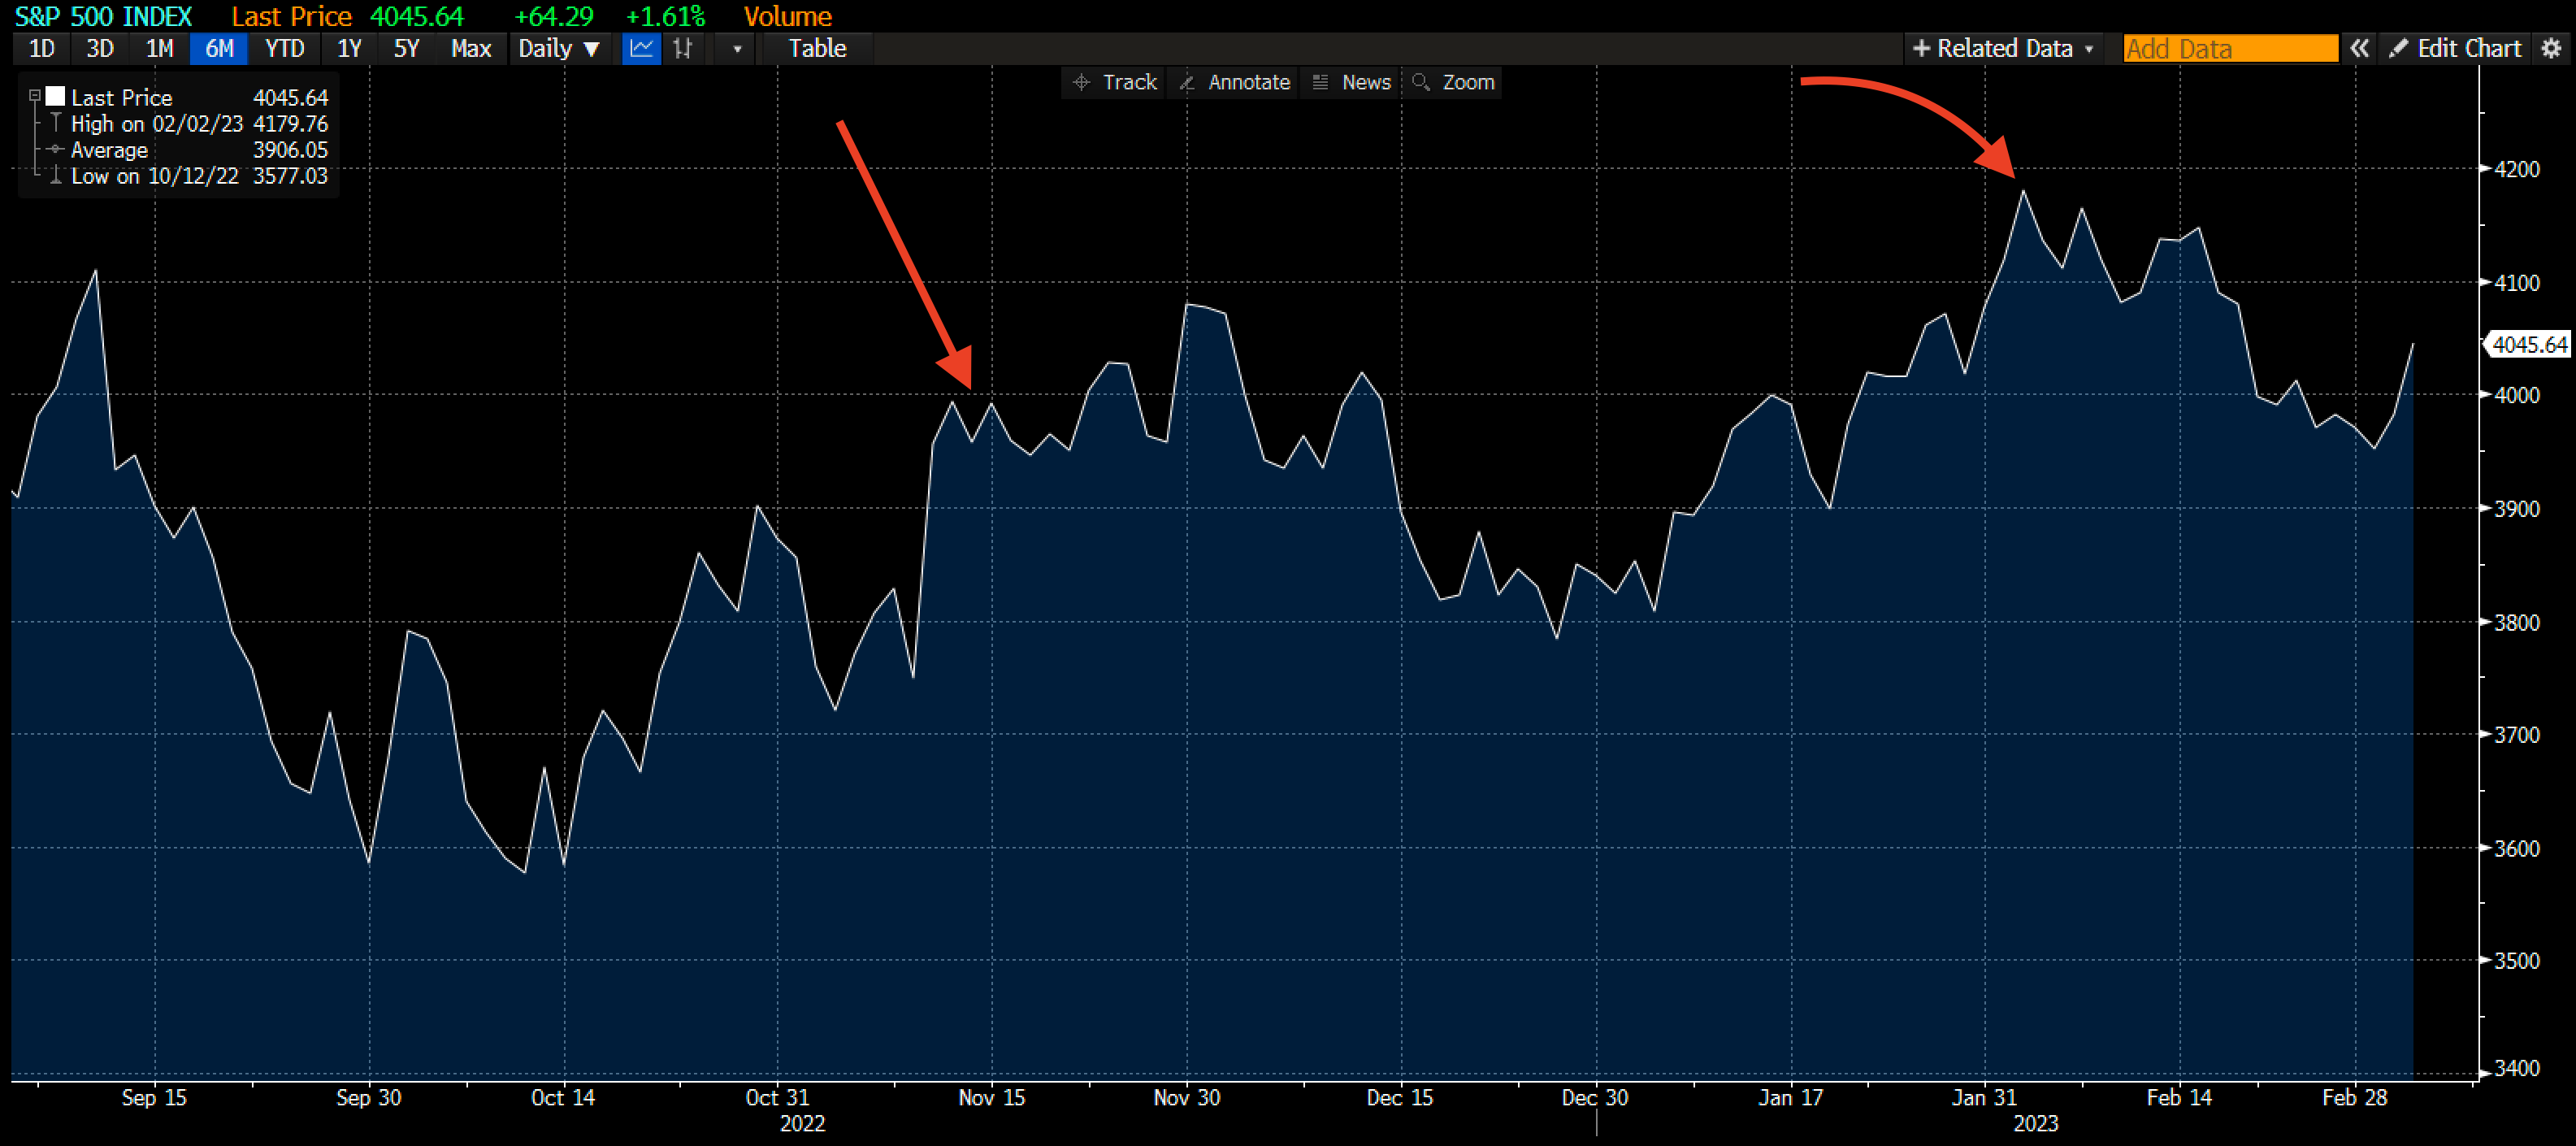
This extreme call buying is an effective strategy, as the surge in relative call volumes highlighted above (red arrows, 11/15/22 & 2/2/23) correspond with +6% & +4% rallies, respectively.
This brings us back around to the current market positioning. As per Fridays post (and map below), we viewed a move above the 402 Call Wall as a bullish development for equities – but the obvious curve ball here is Powell. Barring a “Jackson Hole 2.0″, we are compelled to maintain a bullish stance based on the S&P >4000, and the behavior of IV over the past week (IV down in the face of lower equities).

This pullback in SPX prices to the 4000 equilibrium, relatively low IV, and proximity to the large March OPEX is a great setup for a strong directional move out of Powell’s testimony.
And, while we are unsure of what Powell will say, the setup we see here for speculative call buyers is a good one. Any benign and/or dovish read from Powell could spark a quick round of large call buying, invoking VIX up/Market up style behavior. Further, there is ~4% SPX distance before hitting the 4200 area resistance which capped the Index in Feb & Aug ’22.
If we do get a sharp call based rally, we would look for market strength to persist into early next week, with OPEX week then forming a pin up near 4200. In contrast, should Powell deliver a blow to markets, we would anticipate a quick move <3900 as negative gamma + elevated IV draw markets lower into 3/17 OPEX.
| SpotGamma Proprietary SPX Levels | Latest Data | SPX Previous | SPY | NDX | QQQ |
|---|---|---|---|---|---|
| Reference Price: | 4045 | 4040 | 404 | 12290 | 299 |
| SG Implied 1-Day Move: | 0.9%, | (±pts): 36.0 | VIX 1 Day Impl. Move:1.17% | ||
| SG Implied 5-Day Move: | 2.55% | 4045 (Monday Reference Price) | Range: 3942.0 | 4149.0 | ||
| SpotGamma Gamma Index™: | 0.26 | -0.43 | -0.31 | 0.04 | -0.08 |
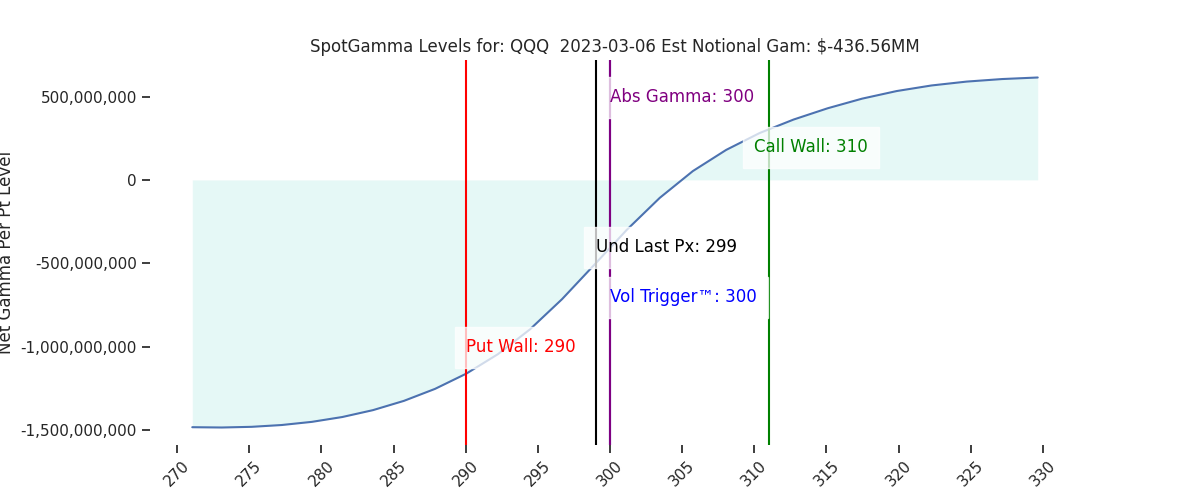
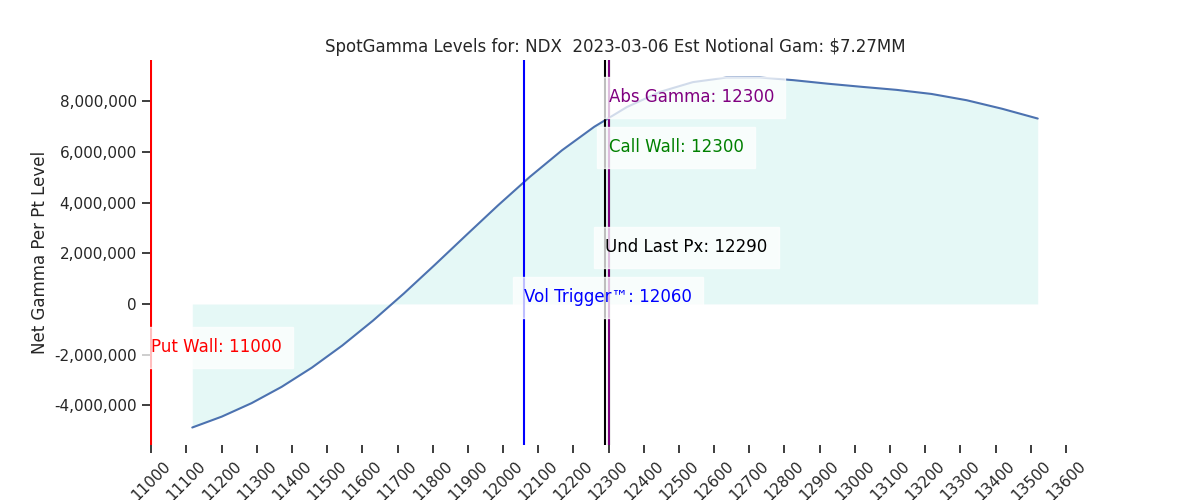
| Volatility Trigger™: | 4020 | 3975 | 403 | 12060 | 300 |
| SpotGamma Absolute Gamma Strike: | 4000 | 4000 | 400 | 12300 | 300 |
| Gamma Notional (MM): | 37.0 | 213.0 | -1364.0 | 7.0 | -437.0 |
| Call Wall: | 4200 | 4200 | 408 | 12300 | 310 |
| Put Wall: | 3900 | 3900 | 390 | 11000 | 290 |
| Additional Key Levels | Latest Data | Previous | SPY | NDX | QQQ |
|---|---|---|---|---|---|
| Zero Gamma Level: | 4027 | 3992 | 409.0 | 11635.0 | 308 |
| Gamma Tilt: | 1.05 | 1.09 | 0.69 | 1.53 | 0.77 |
| Delta Neutral Px: | 3982 | ||||
| Net Delta (MM): | $1,504,939 | $1,603,035 | $180,230 | $51,505 | $97,676 |
| 25 Day Risk Reversal: | -0.03 | -0.05 | -0.02 | -0.03 | -0.03 |
| Call Volume: | 578,470 | 603,091 | 1,873,836 | 10,380 | 622,578 |
| Put Volume: | 1,013,513 | 944,874 | 3,417,211 | 8,757 | 1,200,028 |
| Call Open Interest: | 6,282,218 | 6,247,945 | 6,331,890 | 63,962 | 4,798,165 |
| Put Open Interest: | 10,922,567 | 11,211,174 | 13,541,803 | 63,390 | 8,430,631 |
| Key Support & Resistance Strikes: |
|---|
| SPX: [4100, 4050, 4000, 3950] |
| SPY: [410, 405, 402, 400] |
| QQQ: [305, 300, 295, 290] |
| NDX: [13000, 12500, 12300, 12000] |
| SPX Combo (Strike, Percentile): [(4199.0, 96.13), (4175.0, 86.07), (4151.0, 93.04), (4127.0, 79.22), (4098.0, 94.58), (4094.0, 82.85), (4086.0, 85.48), (4078.0, 78.53), (4074.0, 92.81), (4070.0, 78.62), (4066.0, 94.18), (4062.0, 81.3), (4050.0, 86.33), (4029.0, 77.66), (4005.0, 84.41), (4001.0, 93.34), (3977.0, 81.09), (3953.0, 78.6), (3949.0, 94.78), (3924.0, 88.36), (3904.0, 88.29), (3900.0, 97.17), (3876.0, 81.79), (3855.0, 81.87), (3851.0, 90.99)] |
| SPY Combo: [389.64, 419.55, 394.49, 409.44, 406.21] |
| NDX Combo: [12303.0, 11898.0, 11689.0, 12709.0, 12094.0] |