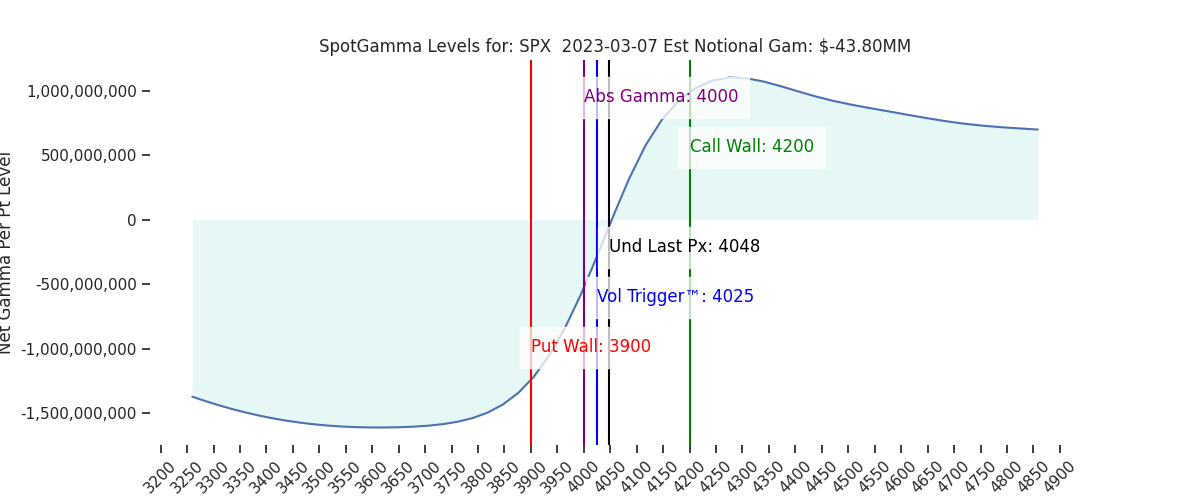
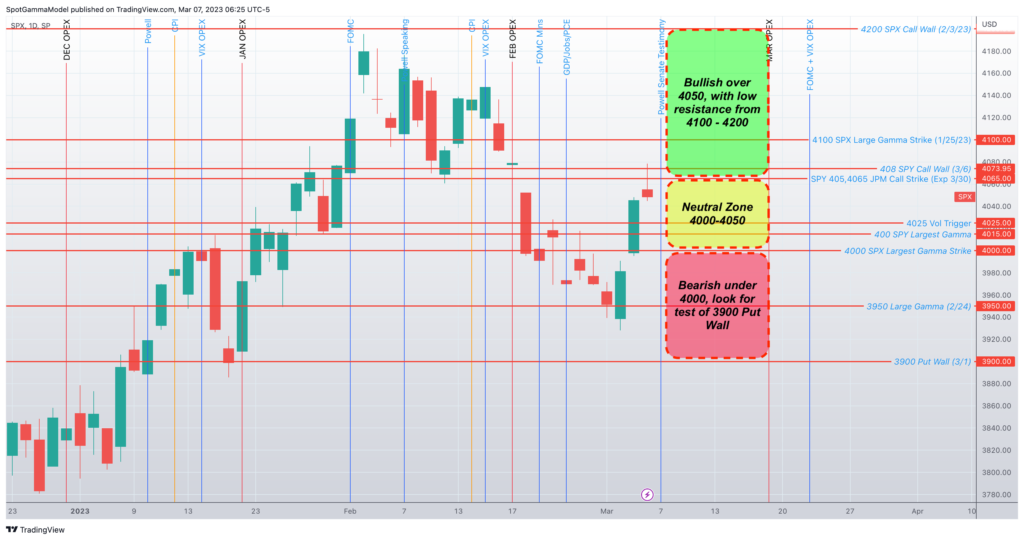
Futures were quiet overnight, holding 4060 ahead of Powell at 10AM ET. The band of resistance levels above remain above at 4050, 4060 (SPY 405), 4070 (SPY 408 Call Wall), then 4100. Major support lies below at 4000.
Our expectations out of Powell this morning remain unchanged from yesterdays AM note (read here). The summary is: we anticipate Powells testimony (both today & tomorrow) to spark directional flow, which may be reinforced by large March OPEX positions. Further, we assign a short term bullish edge into OPEX due to the lack of IV response on recent drawdowns.
In the plot below you can see how large this quarterly OPEX is vs all other expirations. As this expiration is now about a week away, following Powell the March position size should increase (more actively traded), and the gamma should start to concentrate.

As price action feeds into the increase of March 17th options positions, we see two paths. Ultimately a rally into March OPEX may open the market to weakness post-OPEX, where as a decline into March OPEX may lead to a post-OPEX rally.
Adding to this, the decline in implied volatility over the past several weeks has now compressed IV back to levels which has generated bearish responses (see here). There is still room for a final IV squeeze into next week, wherein we could see IV hitting recent lows (and recent SPX highs), right into 3/17 OPEX.
Obviously, if Powell delivers more hawkish testimony, then that higher IV would express now, into March expiration. Either way, we think this higher IV ultimately has to arrive – there is just some path dependency (pre OPEX or post OPEX). Again – we are in the camp that there is one more test higher pre-OPEX, to the 4200 area.
Our reason for ultimately anticipating higher IV is that interest rate uncertainty is not going away – and the low equity IV is in the face of increasing rate IV.
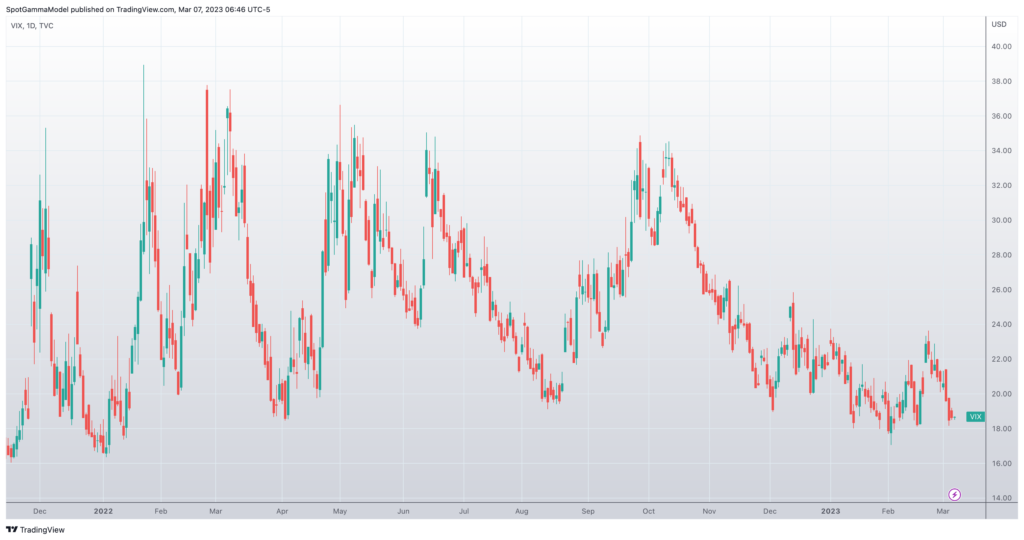
Bond vol is measured via the MOVE Index (white), which has pushed meaningfully higher after Feb FOMC. This rate uncertainty is a core driver of equity vol (VIX, blue), and as that bond vol increases is suggests that equities cannot stabilize (see here).

| SpotGamma Proprietary SPX Levels | Latest Data | SPX Previous | SPY | NDX | QQQ |
|---|---|---|---|---|---|
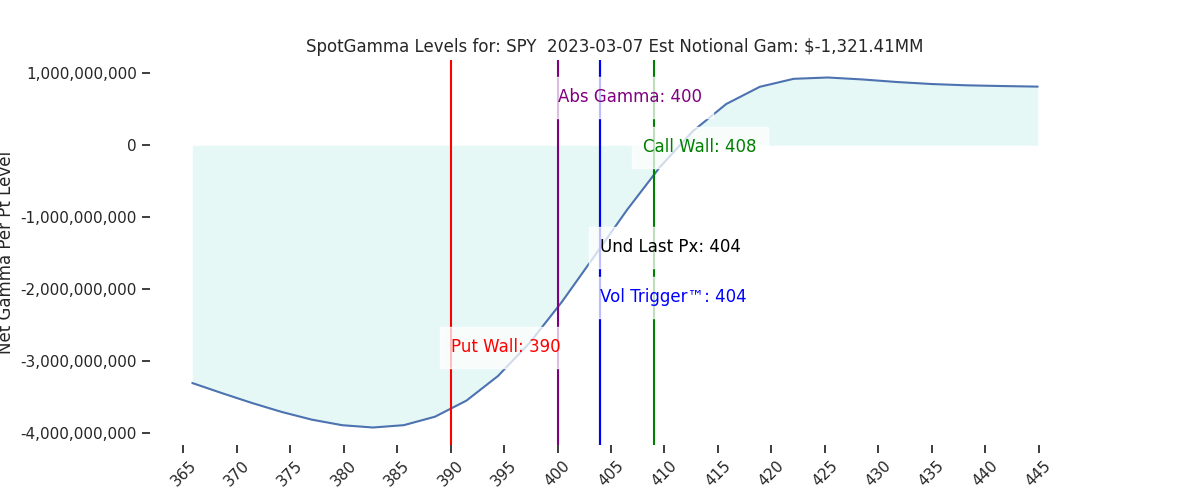
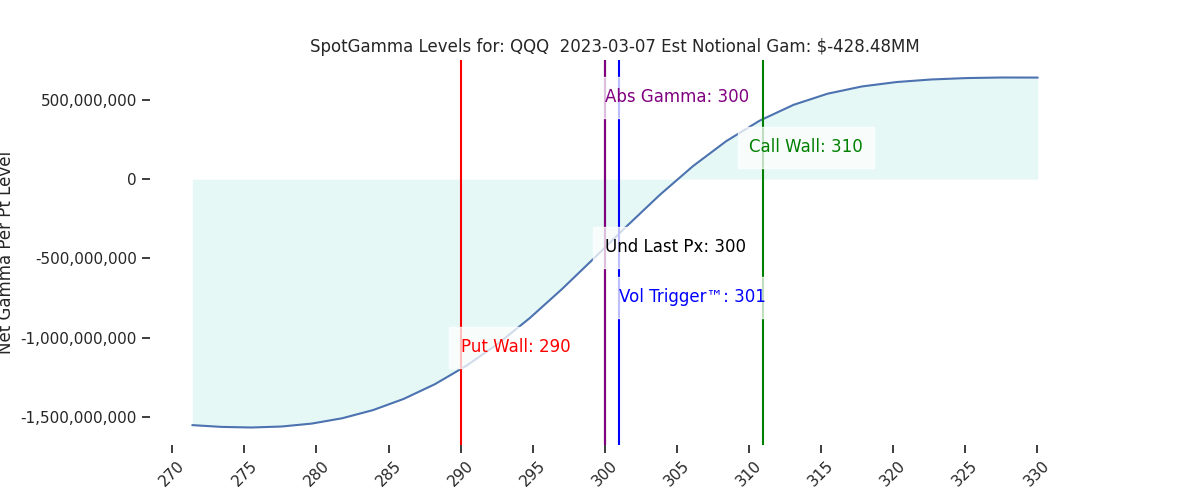
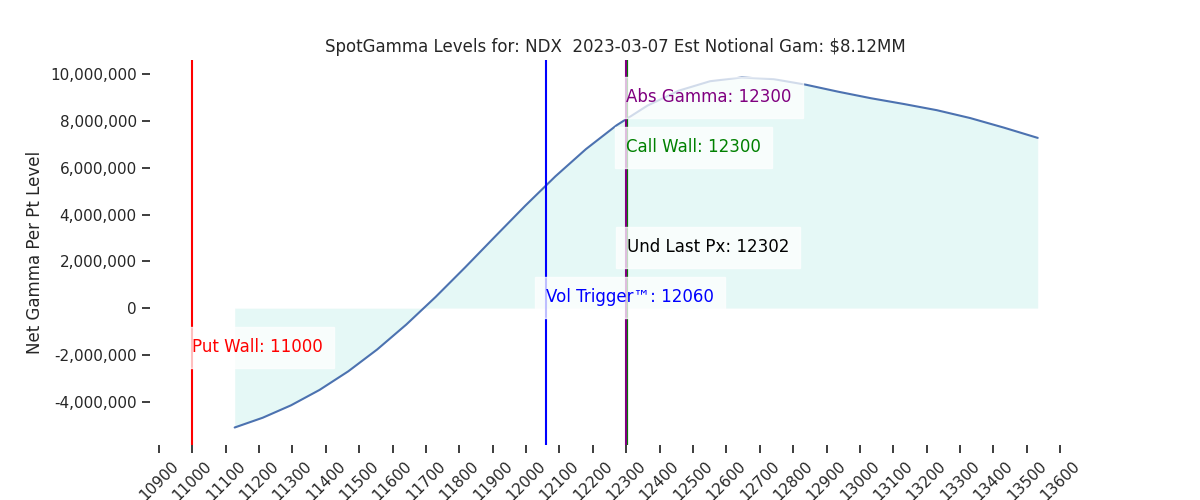
| Reference Price: | 4048 | 4050 | 404 | 12302 | 300 |
| SG Implied 1-Day Move: | 0.87%, | (±pts): 35.0 | VIX 1 Day Impl. Move:1.18% | ||
| SG Implied 5-Day Move: | 2.55% | 4045 (Monday Reference Price) | Range: 3942.0 | 4149.0 | ||
| SpotGamma Gamma Index™: | 0.08 | 0.26 | -0.31 | 0.05 | -0.08 |
| Volatility Trigger™: | 4025 | 4020 | 404 | 12060 | 301 |
| SpotGamma Absolute Gamma Strike: | 4000 | 4000 | 400 | 12300 | 300 |
| Gamma Notional (MM): | -44.0 | 95.0 | -1321.0 | 8.0 | -428.0 |
| Call Wall: | 4200 | 4200 | 408 | 12300 | 310 |
| Put Wall: | 3900 | 3900 | 390 | 11000 | 290 |
| Additional Key Levels | Latest Data | Previous | SPY | NDX | QQQ |
|---|---|---|---|---|---|
| Zero Gamma Level: | 4030 | 4032 | 410.0 | 11646.0 | 309 |
| Gamma Tilt: | 1.02 | 1.04 | 0.7 | 1.58 | 0.79 |
| Delta Neutral Px: | 3984 | ||||
| Net Delta (MM): | $1,513,547 | $1,506,888 | $182,802 | $52,364 | $99,635 |
| 25 Day Risk Reversal: | -0.03 | -0.03 | -0.02 | -0.02 | -0.03 |
| Call Volume: | 582,213 | 578,470 | 1,830,158 | 8,178 | 717,805 |
| Put Volume: | 916,035 | 1,013,513 | 2,739,721 | 9,122 | 1,259,849 |
| Call Open Interest: | 6,342,322 | 6,282,218 | 6,503,512 | 64,720 | 4,939,412 |
| Put Open Interest: | 11,075,667 | 10,922,567 | 13,677,566 | 64,015 | 8,568,474 |
| Key Support & Resistance Strikes: |
|---|
| SPX: [4100, 4050, 4000, 3950] |
| SPY: [410, 405, 400, 390] |
| QQQ: [305, 300, 295, 290] |
| NDX: [13000, 12500, 12300, 12000] |
| SPX Combo (Strike, Percentile): [(4198.0, 96.3), (4174.0, 86.64), (4150.0, 94.28), (4125.0, 87.43), (4105.0, 76.87), (4101.0, 95.63), (4085.0, 79.11), (4077.0, 90.99), (4065.0, 94.67), (4004.0, 87.06), (4000.0, 95.89), (3976.0, 81.24), (3955.0, 85.17), (3951.0, 95.19), (3927.0, 78.56), (3903.0, 86.78), (3899.0, 96.94), (3874.0, 82.39), (3854.0, 83.74), (3850.0, 90.79)] |
| SPY Combo: [389.5, 419.44, 399.62, 409.73, 394.76] |
| NDX Combo: [12302.0, 11896.0, 12708.0, 12093.0, 12512.0] |