While the SPX did close -1.5% yesterday, we viewed the day as a prime example of 0DTE suppressing volatility. There were persistent positive delta flows as the S&P tested the large 4000 support strike. The 4000 level now likely functions as strong resistance, adding a headwind for equity prices. It seems that Powell more “let the air out the bulls balloon” vs “Jackson Hole 2.0”.

That said, rates are obviously on the move. The 2 year UST broke 5% (+15bps) – a level not seen since June ’07. The the 10 year, however was unresponsive post-Powell at 3.96%. While we are not here to comment on the meaning of rate shifts, we continue to monitor increased bond volatility (particularly due to higher rates) as a driver of equity vol (see Tuesdays AM note).

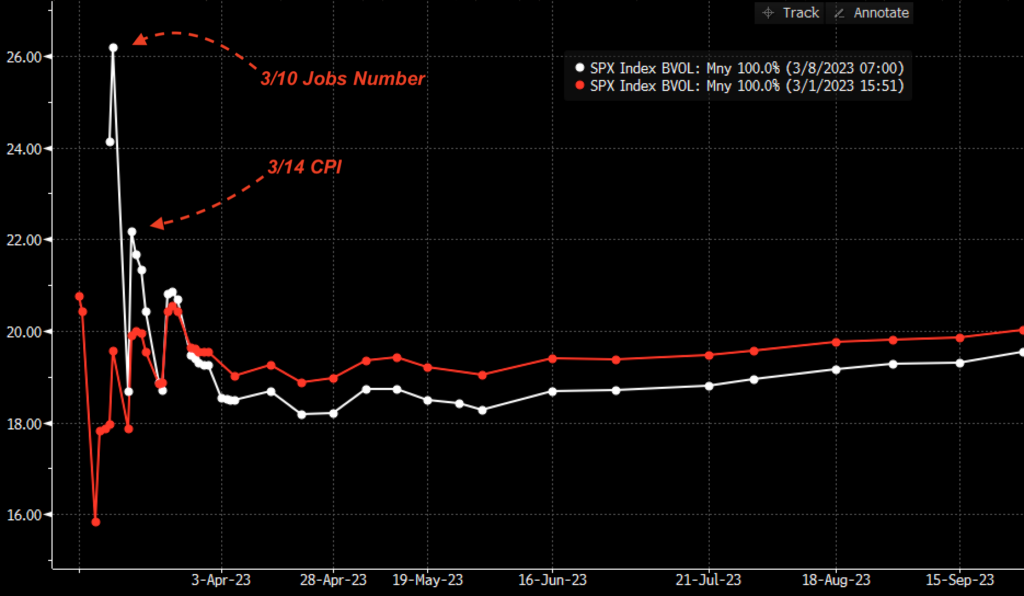
The options markets response to Powell’s testimony, and the higher short term rates, seems to be an immediate focus on incoming data points. This can be seen in the term structure below wherein longer dated IV (white) remains unprovoked, but the IV tied to key short term data points (3/10 jobs, 3/14 CPI) shifted higher. The market seems to hear what Powell is saying, but wants the data to confirm (trust, but verify).
This elevated IV is now likely to hold through next weeks CPI, which reduces vanna as a support mechanism for equities. From a positioning standpoint, the only moderate activity was down at the 3900 & 3850 strikes in SPX. Ultimately, the larger negative gamma readings coming out of yesterday are more of a function of lower S&P prices vs an increase in put positions.
Where things are not quite, is in the VIX options complex. Yesterday we saw nearly 1mm VIX calls trade, which was a similar figure to Feb 2nd. However, these huge call volumes are rather unusual, as shown below.

Additionally, we are seeing record high VIX call open interest. We do view this as long volatility trades, and not driven by some type of VIX ETN/”positional” relationship (like the record put/call readings). The initial read here is that traders are hedging (or betting) and a volatility spike, with much of this volume tied to June & July expirations. Given these very high readings we plan on doing a deeper dive into this data today.

| SpotGamma Proprietary SPX Levels | Latest Data | SPX Previous | SPY | NDX | QQQ |
|---|---|---|---|---|---|
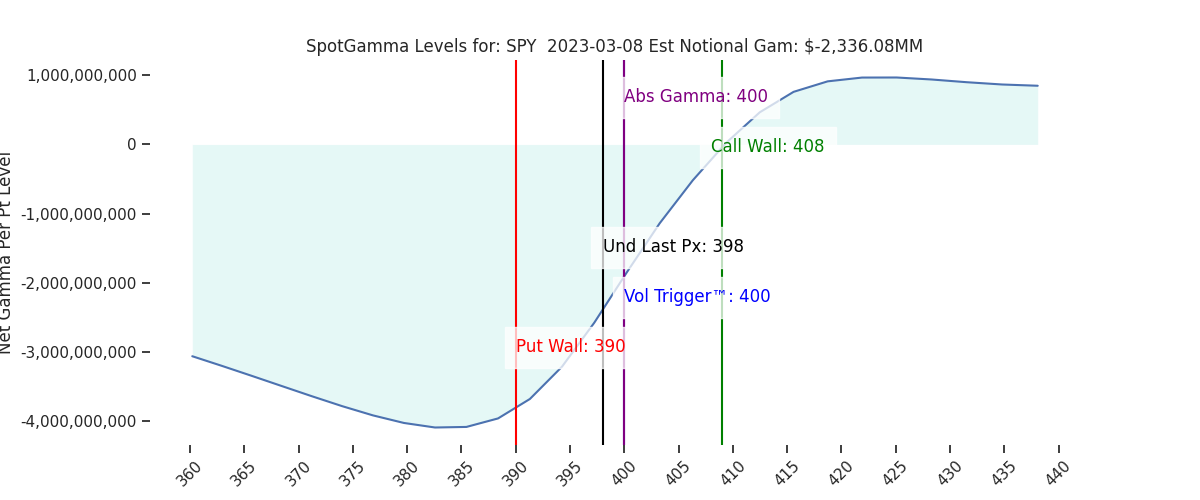
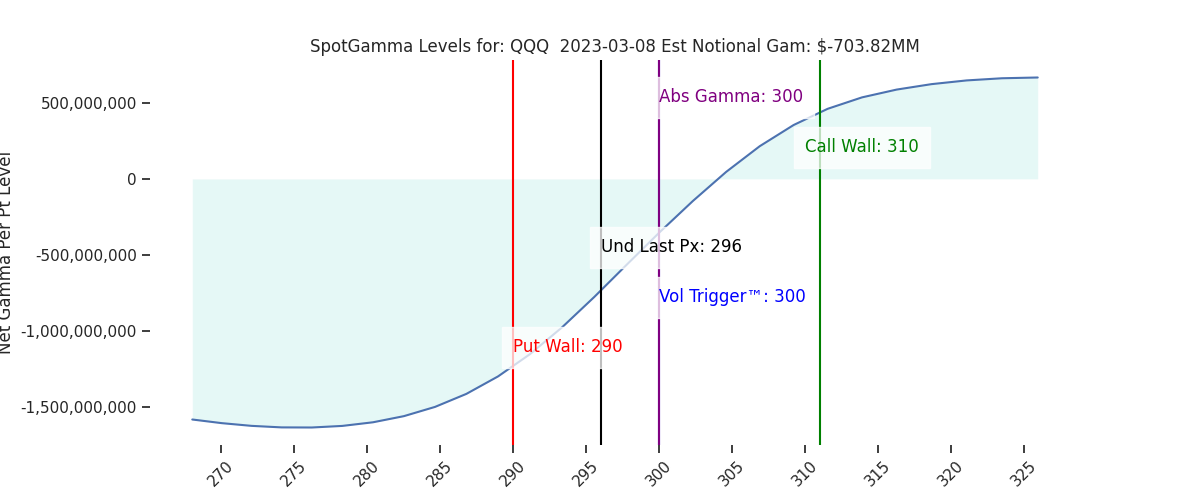
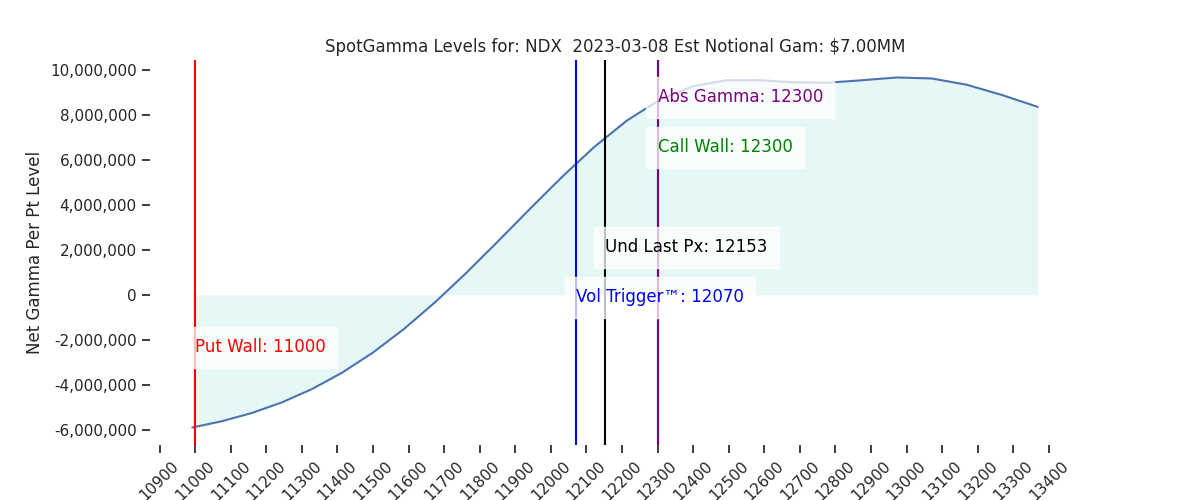
| Reference Price: | 3986 | 3982 | 398 | 12153 | 296 |
| SG Implied 1-Day Move: | 0.85%, | (±pts): 34.0 | VIX 1 Day Impl. Move:1.24% | ||
| SG Implied 5-Day Move: | 2.55% | 4045 (Monday Reference Price) | Range: 3942.0 | 4149.0 | ||
| SpotGamma Gamma Index™: | -1.04 | 0.08 | -0.52 | 0.04 | -0.12 |
| Volatility Trigger™: | 4005 | 4025 | 400 | 12070 | 300 |
| SpotGamma Absolute Gamma Strike: | 4000 | 4000 | 400 | 12300 | 300 |
| Gamma Notional (MM): | -565.0 | -685.0 | -2336.0 | 7.0 | -704.0 |
| Call Wall: | 4200 | 4200 | 408 | 12300 | 310 |
| Put Wall: | 3900 | 3900 | 390 | 11000 | 290 |
| Additional Key Levels | Latest Data | Previous | SPY | NDX | QQQ |
|---|---|---|---|---|---|
| Zero Gamma Level: | 4028 | 4055 | 406.0 | 11679.0 | 307 |
| Gamma Tilt: | 0.82 | 0.76 | 0.57 | 1.46 | 0.69 |
| Delta Neutral Px: | 3953 | ||||
| Net Delta (MM): | $1,490,086 | $1,489,063 | $193,552 | $49,763 | $102,206 |
| 25 Day Risk Reversal: | -0.03 | -0.03 | -0.03 | -0.02 | -0.02 |
| Call Volume: | 650,821 | 582,213 | 2,361,757 | 6,901 | 697,205 |
| Put Volume: | 991,663 | 916,035 | 3,476,087 | 6,450 | 1,064,619 |
| Call Open Interest: | 6,394,858 | 6,342,322 | 6,743,322 | 65,263 | 5,062,250 |
| Put Open Interest: | 11,144,630 | 11,075,667 | 13,885,852 | 64,363 | 8,690,938 |
| Key Support & Resistance Strikes: |
|---|
| SPX: [4050, 4000, 3950, 3900] |
| SPY: [405, 400, 395, 390] |
| QQQ: [300, 295, 290, 285] |
| NDX: [12300, 12200, 12000, 11500] |
| SPX Combo (Strike, Percentile): [(4174.0, 77.06), (4150.0, 89.36), (4102.0, 87.96), (4074.0, 85.23), (4066.0, 91.87), (4030.0, 75.27), (4002.0, 76.28), (3998.0, 96.11), (3978.0, 80.34), (3974.0, 87.36), (3954.0, 92.52), (3950.0, 97.93), (3943.0, 80.81), (3935.0, 85.71), (3927.0, 87.71), (3923.0, 80.1), (3915.0, 82.39), (3903.0, 90.49), (3899.0, 98.77), (3895.0, 76.82), (3875.0, 89.47), (3855.0, 87.85), (3851.0, 94.02), (3827.0, 86.96), (3803.0, 80.08), (3799.0, 97.99)] |
| SPY Combo: [389.5, 379.54, 394.68, 399.45, 384.72] |
| NDX Combo: [12299.0, 11898.0, 11691.0, 12093.0, 12506.0] |