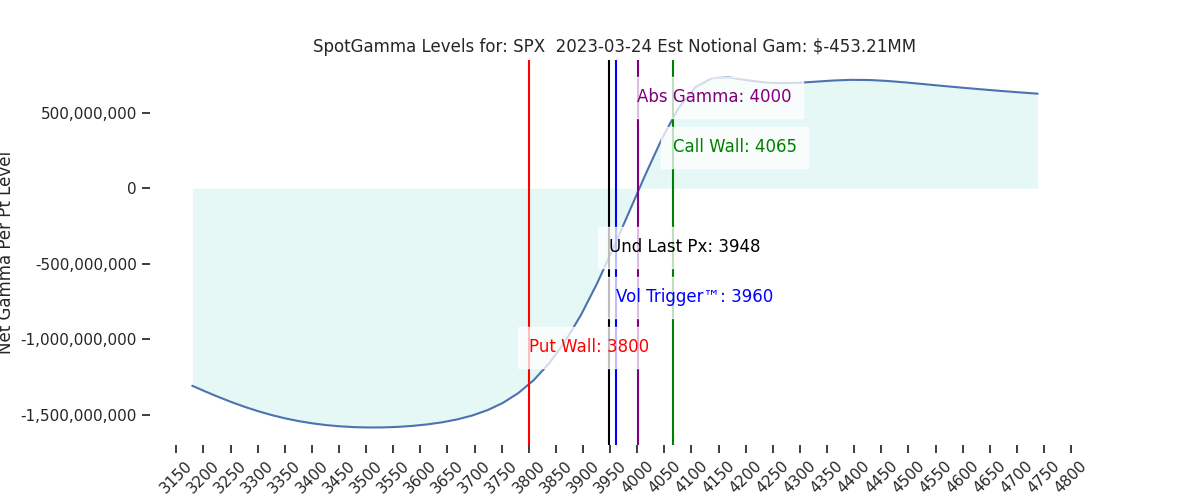
Futures were flat overnight. Key SG levels are unchanged, with 3950 as the pivot, and 4000 as strong overhead resistance. To the downside we mark 3917, and 3900 as support.
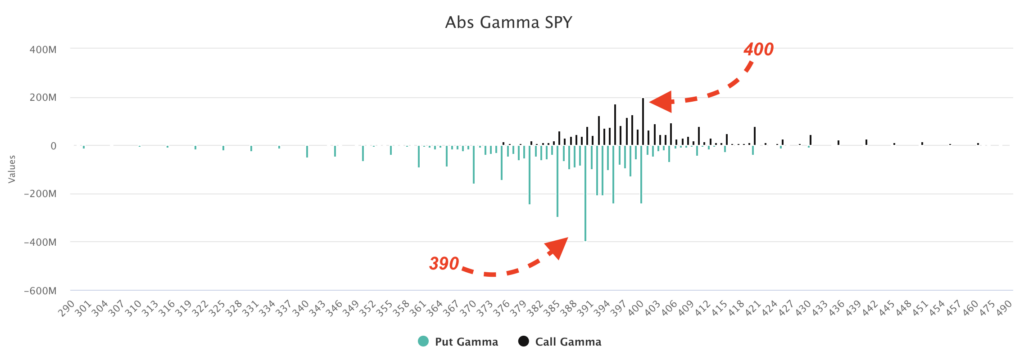
There were heavy volumes at the key relevant strikes yesterday: +100k calls @ 4000, +100k puts at 3950, and +100k puts at 3900. This volume translated to fairly light increases of ~10-15k at these various strikes. Overall the signal with these high volume strikes and build in OI is that volatility should generally reduce in the 3900-4000 range.
The core theme of what we are seeing, despite the nasty intraday reversals seen over the last two sessions, is the selling of upside (as seen yesterday). This is evidenced not just in the very large volumes at overhead strikes like 4000 (which occurred as HIRO displayed call selling), but also in IV, as shown below.
Note the areas of blue which indicate a reduction in IV, which for strikes >3950 can be seen out into April. In the short term we also see downside strike IV decreasing, which suggests traders have reduced downside demand.
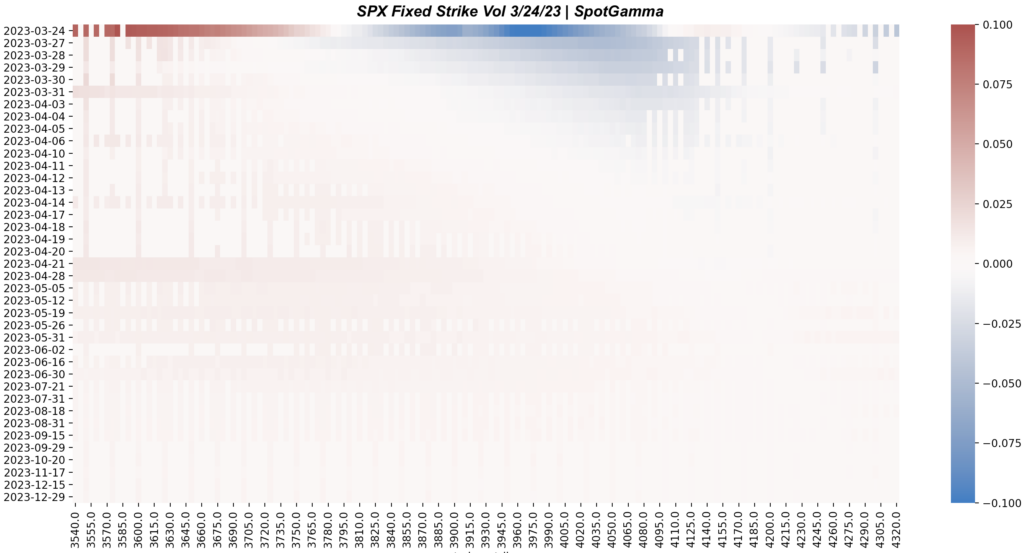
We would note the April expiration does seem to have a bit of downside demand, and this was the expiration we saw targeted for bank hedges in recent weeks. That downside gamma could be something to monitor into mid April.
Tech continues to get a lot of attention, and we continue to receive a lot of questions on the sector outperformance. Yesterday we issued a call looking for consolidation in this space, as many of these names have started to stretch past their large zones of gamma.
This suggests to us that options traders are not continue to position for a chase. We are still of this view, as several of these top tech names have a lot of gamma expiring today (ex: AMD/NVDA) which can often lead to some short term consolidation. Traders will have to continue to reload into upside strikes to keep this momentum going, which is something to watch for next week.
310 is the key gamma level for QQQ today (and a pinning/resistance level), but that strike likely loses its “largest gamma status” to strikes closer to 300 next week.
| SpotGamma Proprietary SPX Levels | Latest Data | SPX Previous | SPY | NDX | QQQ |
|---|---|---|---|---|---|
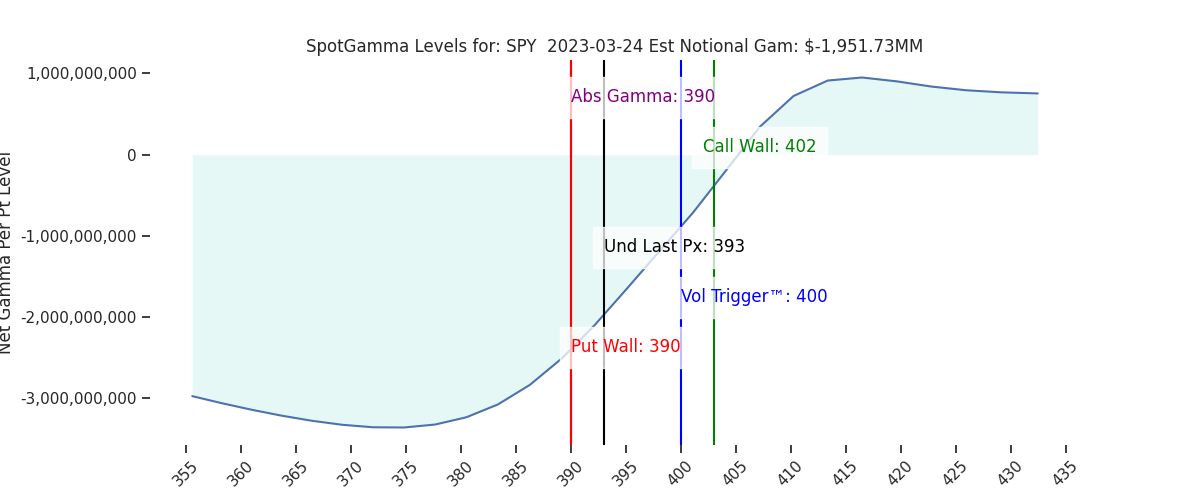
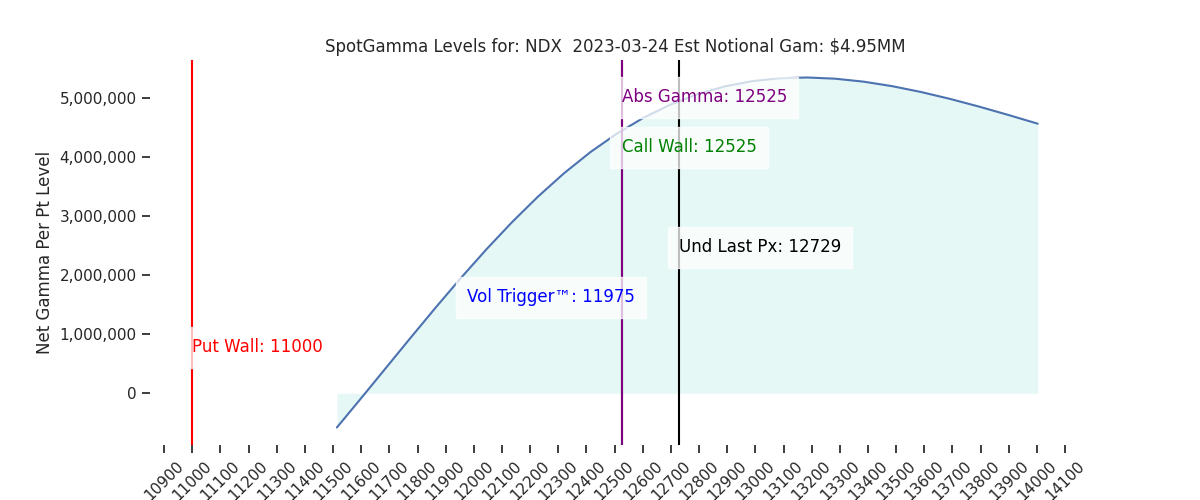
| Reference Price: | 3948 | 3951 | 393 | 12729 | 309 |
| SG Implied 1-Day Move: | 1.16%, | (±pts): 46.0 | VIX 1 Day Impl. Move:1.42% | ||
| SG Implied 5-Day Move: | 2.16% | 3916 (Monday Reference Price) | Range: 3832.0 | 4001.0 | ||
| SpotGamma Gamma Index™: | -0.88 | -1.07 | -0.43 | 0.03 | -0.02 |
| Volatility Trigger™: | 3960 | 4000 | 400 | 11975 | 309 |
| SpotGamma Absolute Gamma Strike: | 4000 | 4000 | 390 | 12525 | 310 |
| Gamma Notional (MM): | -453.0 | -422.0 | -1952.0 | 5.0 | -102.0 |
| Call Wall: | 4065 | 4065 | 402 | 12525 | 320 |
| Put Wall: | 3800 | 3800 | 390 | 11000 | 285 |
| Additional Key Levels | Latest Data | Previous | SPY | NDX | QQQ |
|---|---|---|---|---|---|
| Zero Gamma Level: | 4015 | 4018 | 404.0 | 11631.0 | 339 |
| Gamma Tilt: | 0.77 | 0.78 | 0.56 | 1.62 | 0.94 |
| Delta Neutral Px: | 3975 | ||||
| Net Delta (MM): | $1,239,255 | $1,238,508 | $188,099 | $44,819 | $99,797 |
| 25 Day Risk Reversal: | -0.06 | -0.05 | -0.05 | -0.06 | -0.06 |
| Call Volume: | 556,631 | 577,207 | 2,724,171 | 11,714 | 1,034,763 |
| Put Volume: | 965,499 | 1,021,993 | 4,479,150 | 10,230 | 1,645,208 |
| Call Open Interest: | 5,327,296 | 5,294,249 | 6,580,144 | 50,707 | 4,615,210 |
| Put Open Interest: | 10,475,875 | 10,249,628 | 13,301,032 | 53,345 | 8,290,441 |
| Key Support & Resistance Strikes: |
|---|
| SPX: [4100, 4000, 3950, 3900] |
| SPY: [400, 395, 390, 385] |
| QQQ: [312, 310, 305, 300] |
| NDX: [14000, 13000, 12525, 12000] |
| SPX Combo (Strike, Percentile): [(4099.0, 88.65), (4075.0, 80.89), (4063.0, 92.33), (4051.0, 85.1), (4032.0, 78.54), (3949.0, 94.32), (3917.0, 89.46), (3901.0, 97.33), (3874.0, 78.49), (3866.0, 88.19), (3850.0, 94.04), (3826.0, 83.84), (3818.0, 86.88), (3799.0, 97.56), (3775.0, 81.71)] |
| SPY Combo: [378.21, 388.43, 393.15, 383.32, 404.55] |
| NDX Combo: [12526.0, 13150.0, 12946.0, 12335.0, 12819.0] |