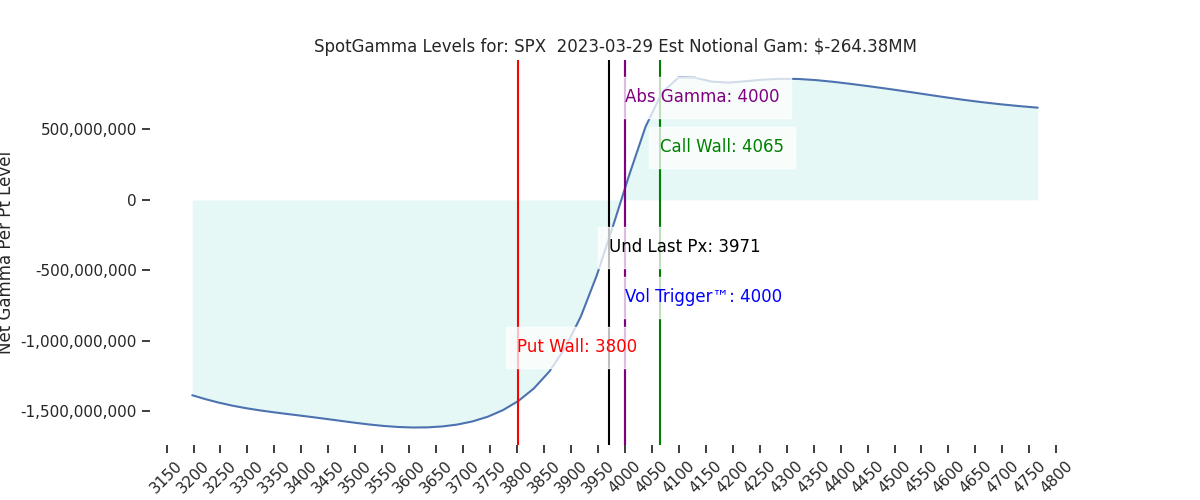
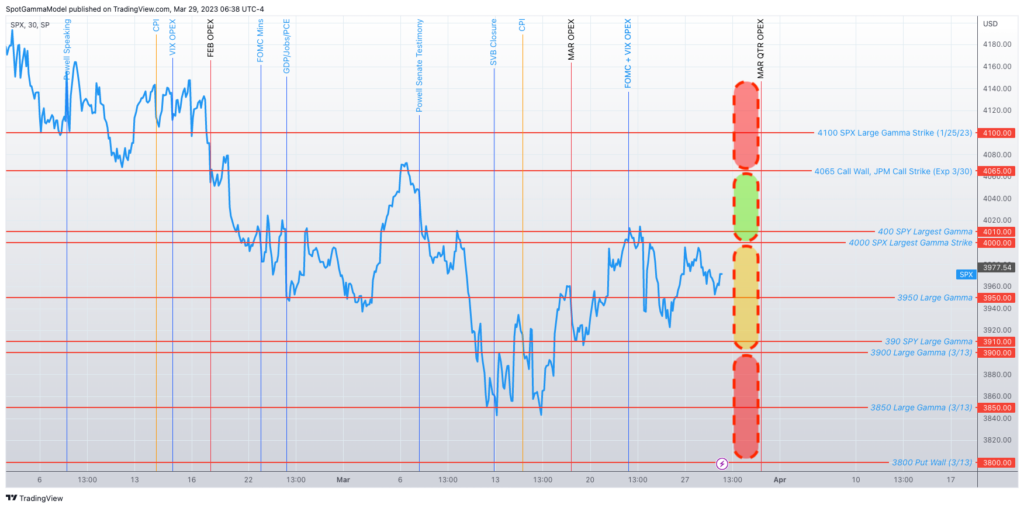
Futures have pressed higher to 4035, indicating a cash open on the large 4000 strike. 4000 – 4010 remains the key resistance line for today, with 4031 above that. To the downside the key range is 3960 (SPY 395) – 3950.
Yesterday was simply churning inside of the big options strikes of 3950-4000. S&P options volumes were light at 2.3m (vs 2.8mm 1 month avg), with the 4000 being the most active strike (115k call volume, 40k put).
Implied volatility was rather muted through yesterdays selloff, and the VIX has moved <20 this morning. On this topic, we highlight the sharp plunge in short dated realized volatility (5 day RV, orange). Earlier this month, volatility was high due the bank crisis and suddenly markets have stopped moving at the 4000 wall.
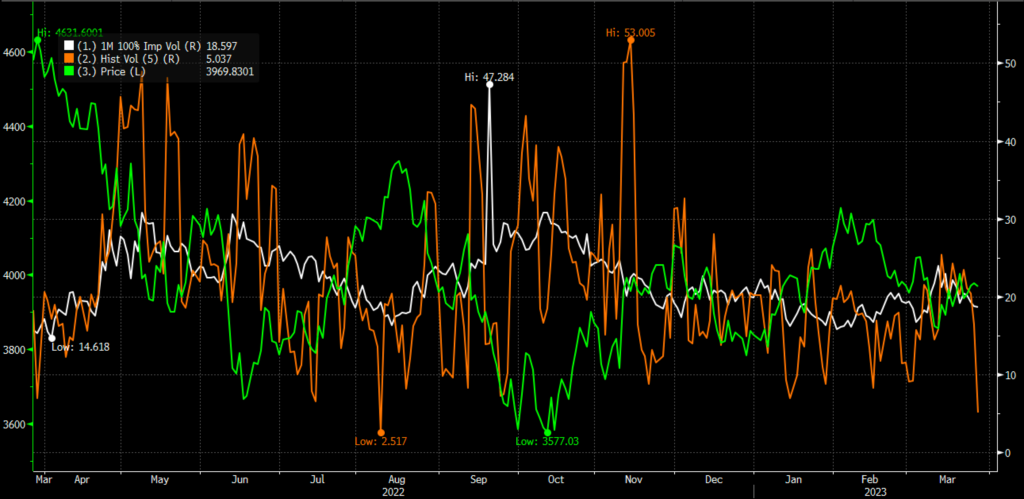
Whats remarkable about this chart is the relatively low level from which 5 day RVplunged. This is obviously a very short dated metric (and subject to a lot of noise), but we think it’s notable. Our read here is that the regulators have papered over the bank crisis well enough to eliminate downside demand, but that does not translate into buying demand.
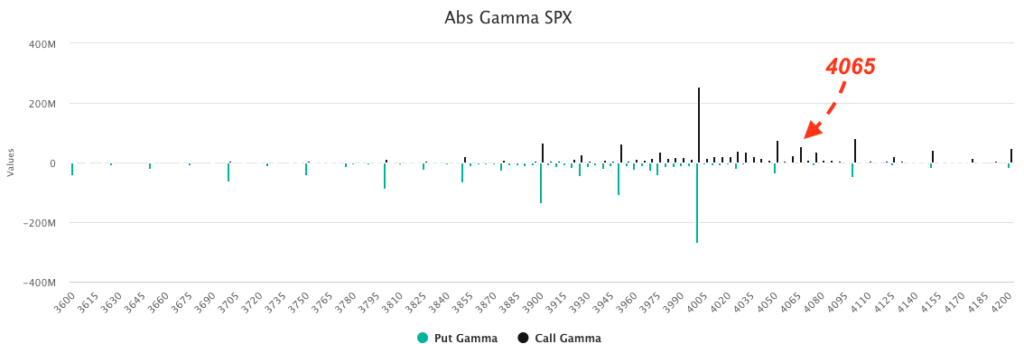
Regardless, if RV is plunging that should pressure IV, and this mornings 19-handle VIX suggests that pressure is underway. This may add to an equity tailwind, and has us eyeing Friday’s 4065 JPM collar call strike.
The 3/31 4065 call currently holds ~$25bn in delta, and while we are near 4000 the decay of that call should, if anything, be mildly supportive of the market. The gamma of this position is not particularly large with the S&P at 4000, and we can’t shake the feeling that a “sneak attack” higher into this 4065 area could be in the works. As mentioned above, the IV decline is supportive, as would be a close above 4000. Upside calls for Friday seem fairly priced, and so some cheap upside bets here may be worth the risk.
Into 4050 the gamma of that 4065 strike grows sharply, as should market resistance. We therefore would look into call structures that reflect this resistance, like spreads or flys.
There are a few data hurdles to cross before Friday, namely Jobs & GDP tomorrow & Core PCE Friday. Whats interesting about these data points is the IV assigned to these prints is noticeably reduced vs recent, similar prints. It’s almost as if the bank run reduced traders dependency on incremental data points. This is trend we have been seeing, and may be an important macro construct looking forward.
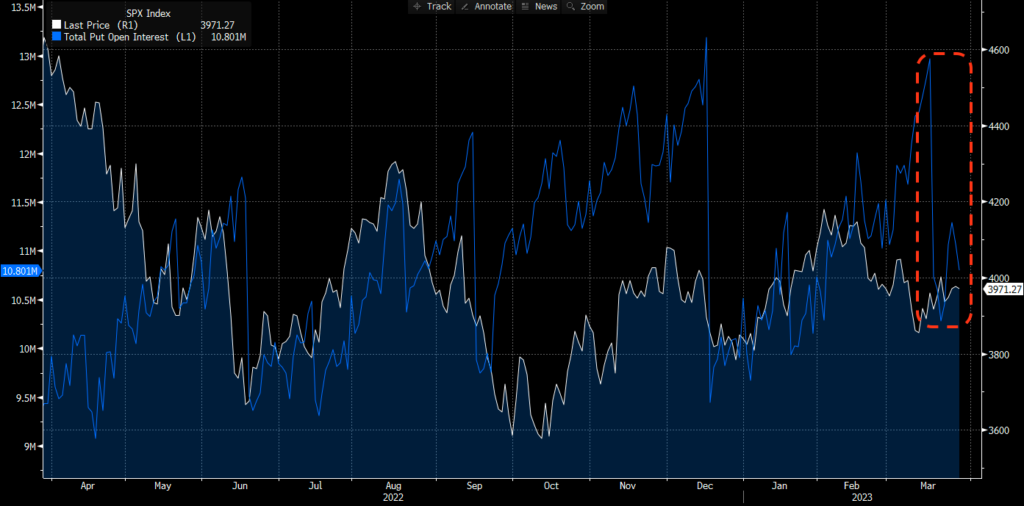
While this lower IV is playing into a supportive market dynamic, as ATM IV starts to drive into the high teens, we view it as oversold. We also have the sharply reduced SPX put OI, and VIX call OI as shown below. We think this starts to open up some opportunities for downside in April as the options market IV approaches a possible lower bound, and downside positioning may have to rebuild.
Ultimately, in the very short term, our views remain unchanged. A move above 4000 may open up a quick test of 4065. We continue to view the 3900-4000 area as neutral, and subject to churning/mean reverting flows. A break of 3900 to the downside likely invokes a test of 3850. We favor downside into April, and that view strengthens if we can pull of an end-of-month rally.
| SpotGamma Proprietary SPX Levels | Latest Data | SPX Previous | SPY | NDX | QQQ |
|---|---|---|---|---|---|
| Reference Price: | 3971 | 3971 | 395 | 12611 | 307 |
| SG Implied 1-Day Move: | 1.17%, | (±pts): 46.0 | VIX 1 Day Impl. Move:1.26% | ||
| SG Implied 5-Day Move: | 3.01% | 3970 (Monday Reference Price) | Range: 3851.0 | 4091.0 | ||
| SpotGamma Gamma Index™: | -0.39 | -0.35 | -0.34 | 0.03 | -0.04 |
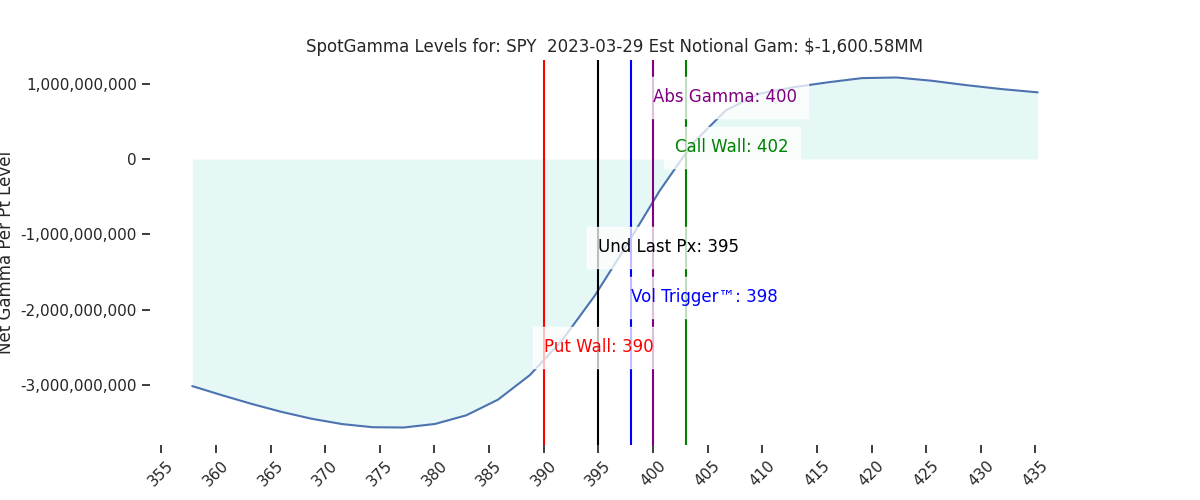
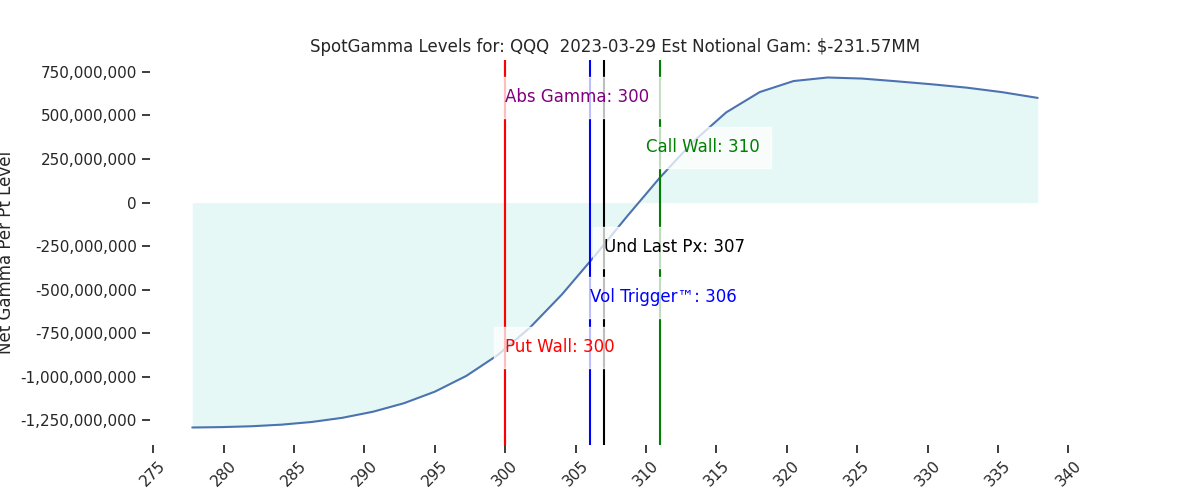
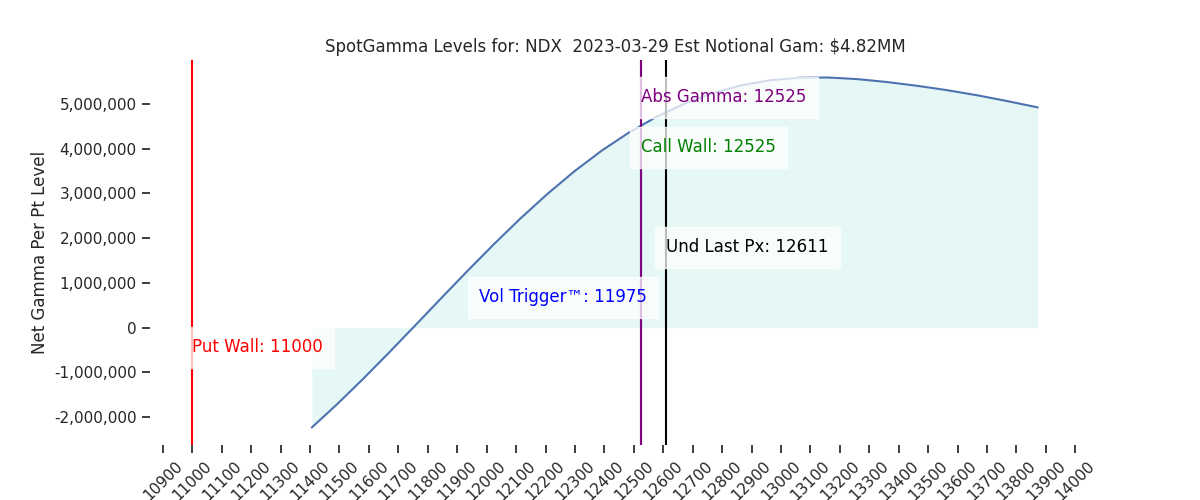
| Volatility Trigger™: | 4000 | 4000 | 398 | 11975 | 306 |
| SpotGamma Absolute Gamma Strike: | 4000 | 4000 | 400 | 12525 | 300 |
| Gamma Notional (MM): | -264.0 | -290.0 | -1601.0 | 5.0 | -232.0 |
| Call Wall: | 4065 | 4065 | 402 | 12525 | 310 |
| Put Wall: | 3800 | 3800 | 390 | 11000 | 300 |
| Additional Key Levels | Latest Data | Previous | SPY | NDX | QQQ |
|---|---|---|---|---|---|
| Zero Gamma Level: | 4008 | 4008 | 401.0 | 11697.0 | 339 |
| Gamma Tilt: | 0.9 | 0.85 | 0.64 | 1.54 | 0.87 |
| Delta Neutral Px: | 3968 | ||||
| Net Delta(MM): | $1,202,082 | $1,199,978 | $175,325 | $42,890 | $95,364 |
| 25 Day Risk Reversal: | -0.04 | -0.04 | -0.03 | -0.04 | -0.04 |
| Call Volume: | 489,168 | 420,939 | 1,721,575 | 9,665 | 628,408 |
| Put Volume: | 753,079 | 766,663 | 2,226,968 | 6,265 | 964,739 |
| Call Open Interest: | 5,488,038 | 5,384,891 | 6,612,474 | 50,257 | 4,607,440 |
| Put Open Interest: | 10,521,517 | 10,382,458 | 13,265,180 | 53,966 | 8,313,822 |
| Key Support & Resistance Strikes: |
|---|
| SPX: [4100, 4000, 3950, 3900] |
| SPY: [400, 395, 390, 385] |
| QQQ: [310, 305, 300, 290] |
| NDX: [14000, 13000, 12525, 12000] |
| SPX Combo (Strike, Percentile): [(4150.0, 85.28), (4098.0, 90.06), (4075.0, 89.15), (4067.0, 95.39), (4059.0, 81.36), (4051.0, 92.13), (4035.0, 84.29), (4031.0, 88.72), (4027.0, 84.68), (4019.0, 75.62), (3999.0, 75.14), (3963.0, 81.83), (3951.0, 93.63), (3924.0, 85.28), (3916.0, 91.83), (3900.0, 96.94), (3876.0, 82.5), (3864.0, 88.22), (3848.0, 93.63), (3824.0, 83.24), (3816.0, 82.42), (3801.0, 97.35)] |
| SPY Combo: [378.63, 388.52, 405.14, 393.66, 383.38] |
| NDX Combo: [12523.0, 12321.0, 12725.0, 13141.0, 12939.0] |