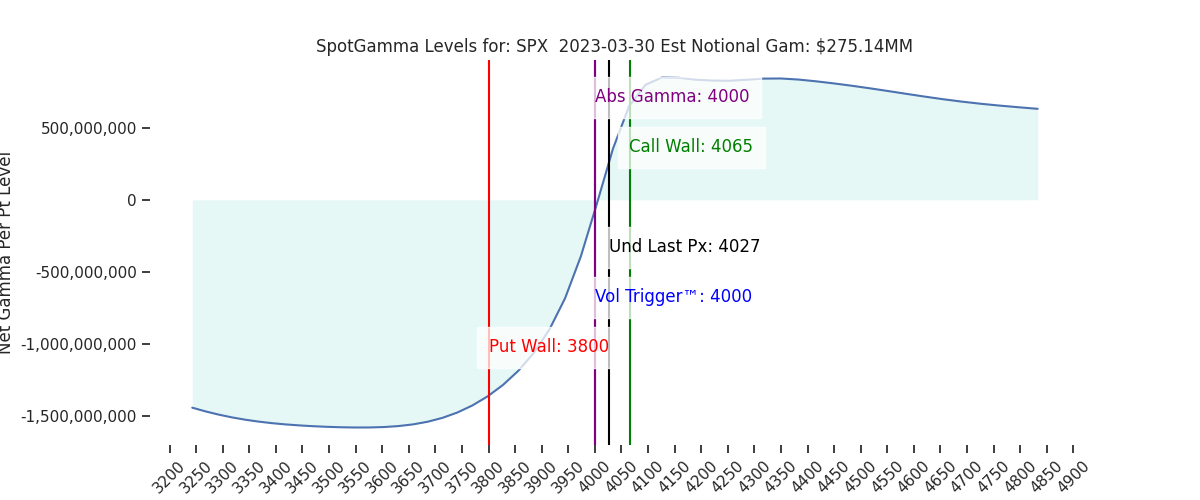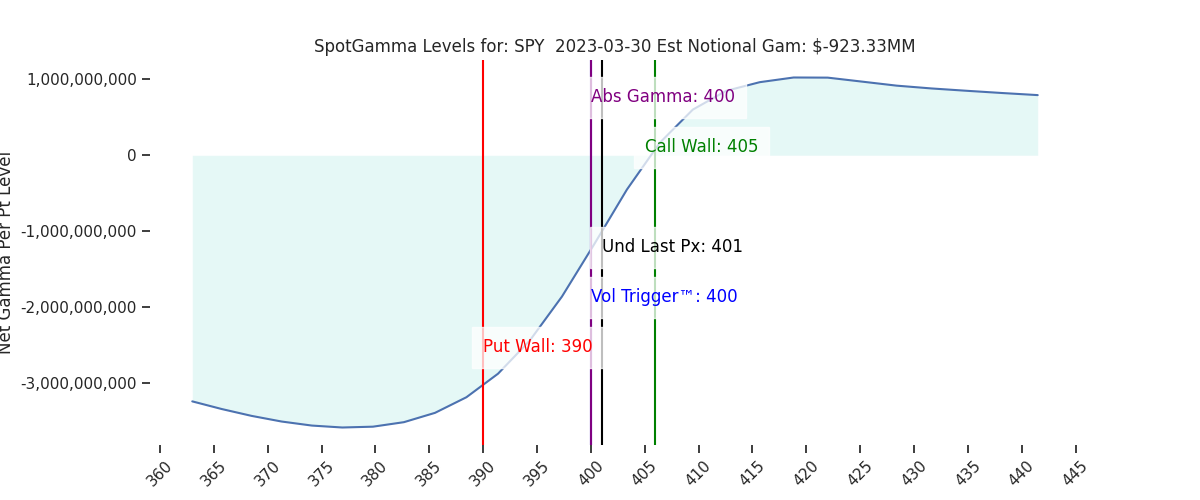
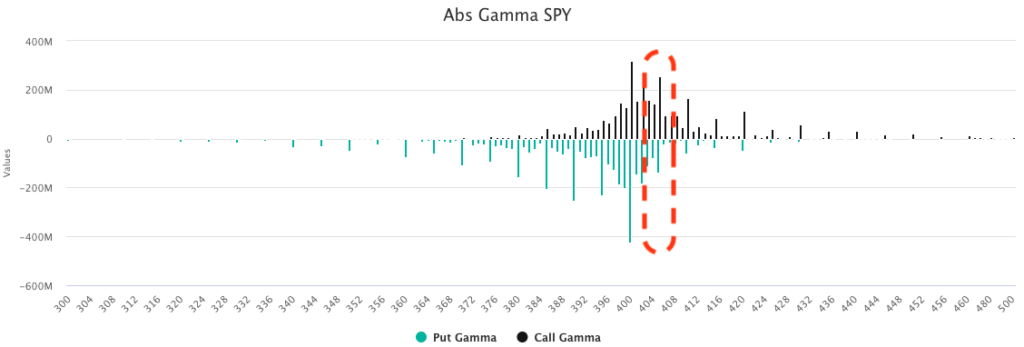
Futures are higher this morning, to 4070. This places the market up near our final resistance line of the 4065 Call Wall, which is just above other resistance lines at 4050 & 4060 (SPY 405 Call Wall). To the downside key resistance lies at 4010 (SPY 400) & 4000.
While this shift higher certainly punches up the gamma at heavily-watched 4065 strike, we note that SPY 405 Call Wall is actually larger, in notional terms. This adds to what we see as resistance as the S&P approaches these strikes.
IV continues to collapse, as shown below (white). We touched on this theme yesterday, wherein IV may be approaching a lower bound just as we push into heavy resistance & a key options expiration on 3/31. As general ATM IV approaches 16%, it implies 1% daily S&P moves which has been the minimum of what the S&P has been realizing (orange) since Jan of ’22.
As IV moves <18% we consider it too low, and suggests a buying opportunity. This concept of IV collapse/compression is one you can dive into here.

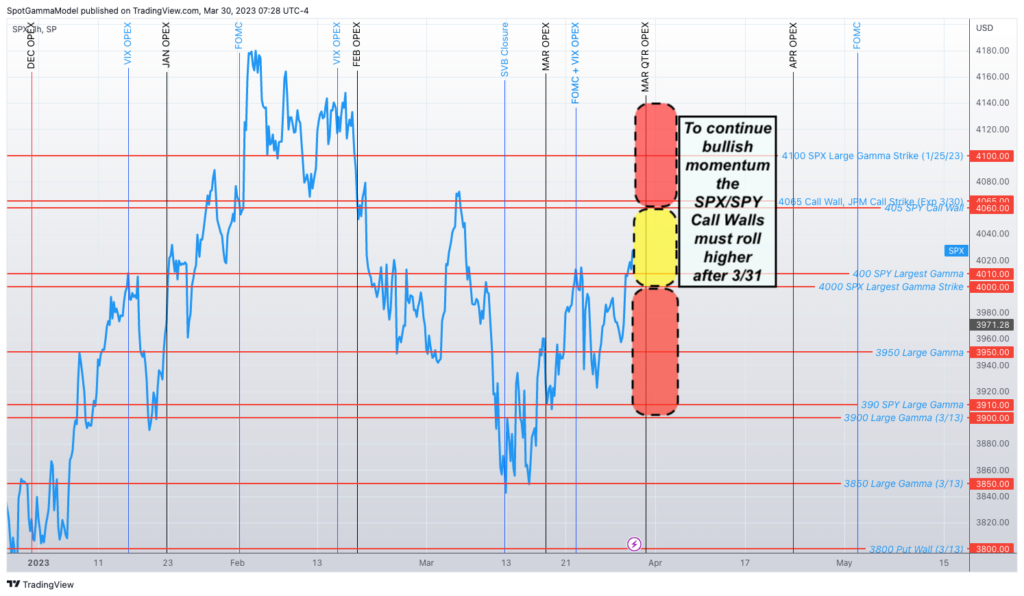
Our view has been that a break above 4000 would lead to a test of 4065 (see price map from 3/27), and this was reiterated with our long call idea from yesterday. We now shift away from bullish in the 4000-4065 range as, based on current futures prices, the upside move is likely complete. To extend the bullish momentum, the Call Walls need to shift higher. There will undoubtedly be a shift in the SPX Call Wall due to Friday’s JPM roll – it’s the SPY Wall movement that may be more of an interesting signal going forward.
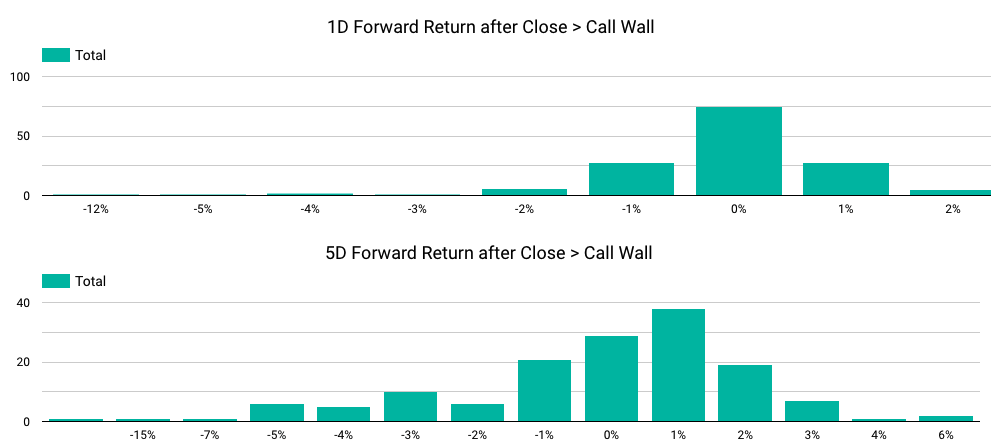
If you look at the data around a breach of the Call Wall (which technically hasn’t happened yet), you can see that the S&P tends to stick at the Call Wall 1 day forward (top), but exhibits a negative skew of -0.25% 5 days ahead.
To the downside we view the loss of 4000 as bearish, particularly through the lens of “fully compressed” IV. A break of 4000 likely invokes a quick test of 3950.
| SpotGamma Proprietary SPX Levels | Latest Data | SPX Previous | SPY | NDX | QQQ |
|---|---|---|---|---|---|
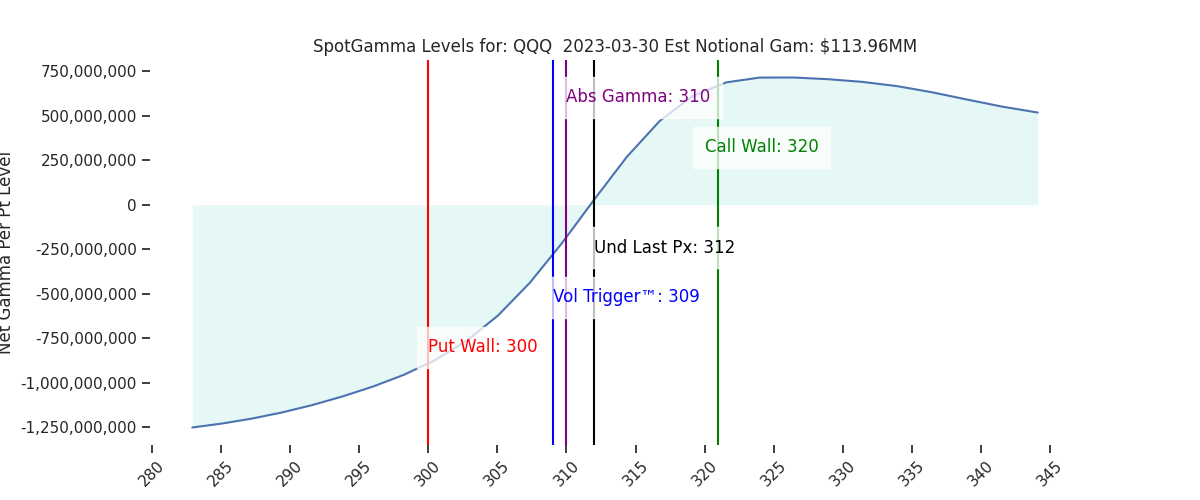
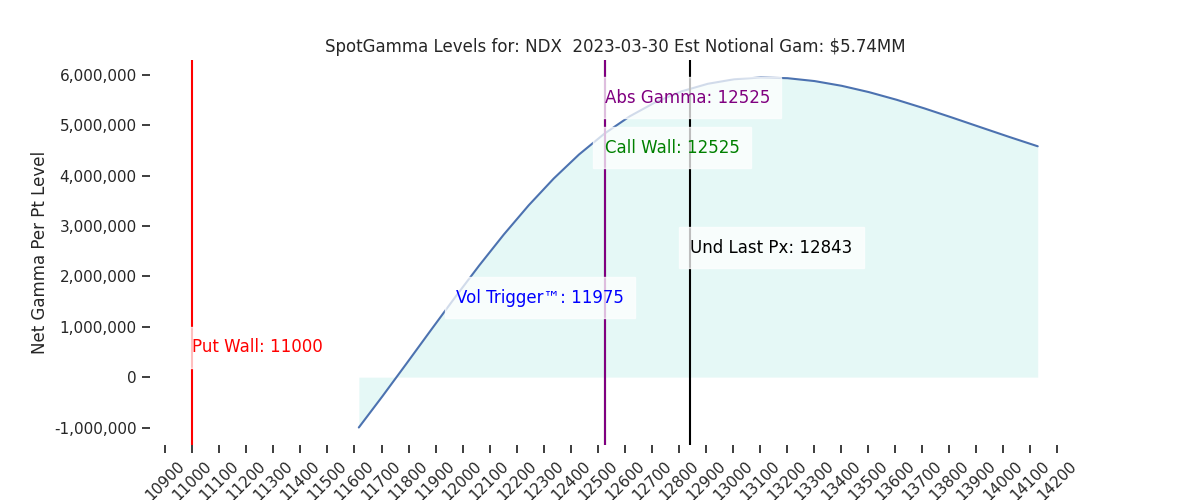
| Reference Price: | 4027 | 4027 | 401 | 12843 | 312 |
| SG Implied 1-Day Move: | 1.08%, | (±pts): 43.0 | VIX 1 Day Impl. Move:1.21% | ||
| SG Implied 5-Day Move: | 3.01% | 3970 (Monday Reference Price) | Range: 3851.0 | 4091.0 | ||
| SpotGamma Gamma Index™: | 0.77 | -0.4 | -0.20 | 0.04 | 0.02 |
| Volatility Trigger™: | 4000 | 4000 | 400 | 11975 | 309 |
| SpotGamma Absolute Gamma Strike: | 4000 | 4000 | 400 | 12525 | 310 |
| Gamma Notional (MM): | 275.0 | 406.0 | -923.0 | 6.0 | 114.0 |
| Call Wall: | 4065 | 4065 | 405 | 12525 | 320 |
| Put Wall: | 3800 | 3800 | 390 | 11000 | 300 |
| Additional Key Levels | Latest Data | Previous | SPY | NDX | QQQ |
|---|---|---|---|---|---|
| Zero Gamma Level: | 4034 | 4004 | 403.0 | 11734.0 | 340 |
| Gamma Tilt: | 1.21 | 1.24 | 0.78 | 1.69 | 1.07 |
| Delta Neutral Px: | 3964 | ||||
| Net Delta (MM): | $1,242,904 | $1,219,054 | $180,723 | $45,454 | $99,919 |
| 25 Day Risk Reversal: | -0.04 | -0.04 | -0.04 | -0.04 | -0.04 |
| Call Volume: | 565,489 | 489,168 | 1,695,468 | 6,632 | 628,737 |
| Put Volume: | 783,502 | 753,079 | 2,816,843 | 7,853 | 1,054,570 |
| Call Open Interest: | 5,510,436 | 5,488,038 | 6,678,730 | 50,850 | 4,692,830 |
| Put Open Interest: | 10,658,829 | 10,521,517 | 13,839,781 | 54,459 | 8,524,797 |
| Key Support & Resistance Strikes: |
|---|
| SPX: [4100, 4065, 4050, 4000] |
| SPY: [405, 402, 400, 398] |
| QQQ: [315, 310, 305, 300] |
| NDX: [14000, 13000, 12525, 12000] |
| SPX Combo (Strike, Percentile): [(4201.0, 93.38), (4148.0, 89.77), (4124.0, 82.24), (4100.0, 95.4), (4084.0, 86.36), (4080.0, 86.21), (4076.0, 97.07), (4068.0, 87.0), (4064.0, 99.76), (4060.0, 93.94), (4056.0, 89.52), (4052.0, 96.62), (4044.0, 77.63), (4039.0, 81.38), (4035.0, 84.8), (4031.0, 90.88), (4023.0, 81.13), (4019.0, 78.31), (3999.0, 84.03), (3963.0, 79.03), (3951.0, 93.09), (3923.0, 80.12), (3915.0, 85.26), (3899.0, 95.01), (3862.0, 76.7), (3850.0, 91.25)] |
| SPY Combo: [404.96, 406.17, 403.76, 408.57, 388.51] |
| NDX Combo: [13139.0, 12522.0, 12933.0, 12895.0, 12317.0] |