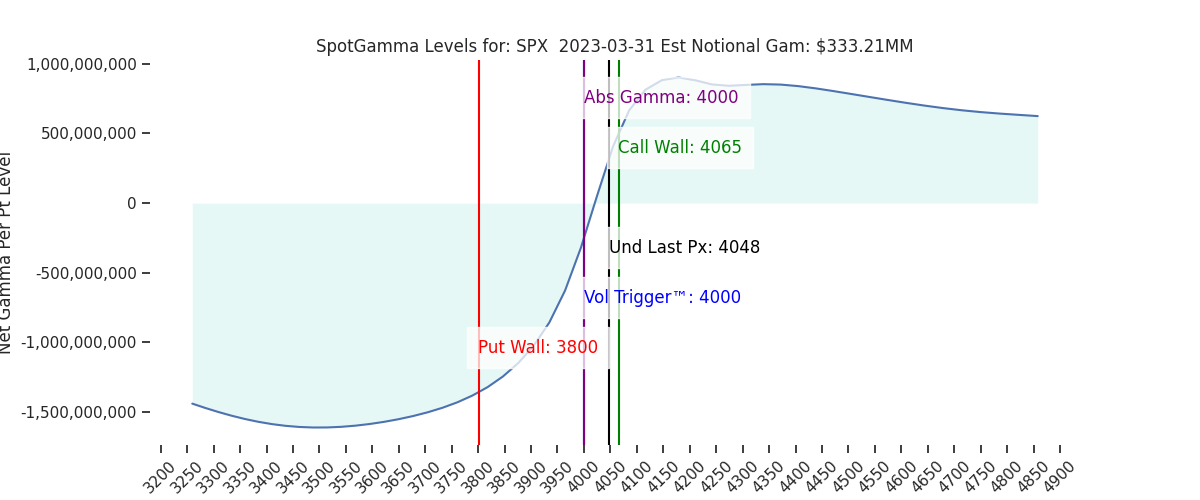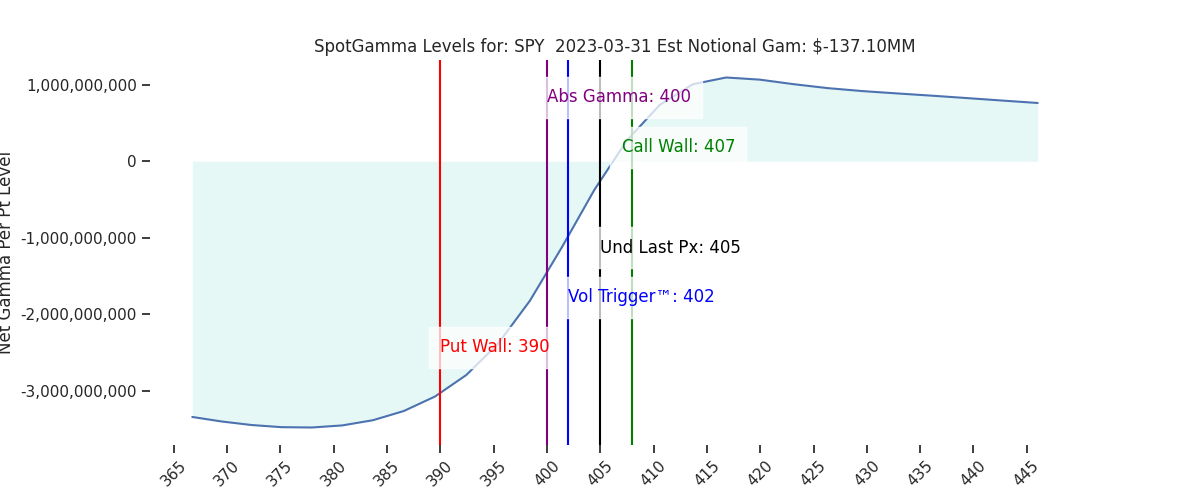
Futures are modestly higher to 4080. This morning we see the SPY Call Wall roll higher to 407 (SPX 4080 equivalent), while the SPX Call Wall holds at 4065. This implies the max resistance is now 4065-4080 for today, vs 4050-4065 yesterday. Other key SG levels remain the same: support shows at 4028, then 4010 (SPY 400) – 4000.
Todays JPM roll may have a strong impact to markets, as somewhere mid-morning we are likely to see the initial roll placed (3-5% OTM call vs ~5% OTM put spread). That spread likely prints with some type of deep ITM 0DTE call, and all of this is followed up by a late day spread adjustment (the flip the original spread to the final strikes, adjusting for any intraday market movement). This trade is obviously heavily watched, and the implementation is likely adjusted to mitigate signals & impact. Simply said: it’s hard to draw any conclusion/edge of the trades impact. Clouding this, too, are quarter end flows.
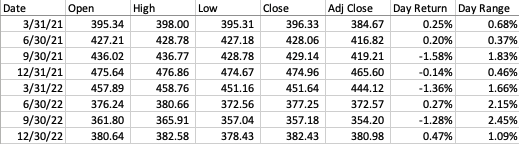
Whats clear from the data is that the quarter end sessions either seem to be flat or down, as shown in the table below. As you can see in the table of quarterly trading days below, the market tends to stay relatively flat to rather sharply lower. Given that we are up against our Call Walls today (based on pre-market futures), we would wager that “flat to lower” is in the cards for today, too.
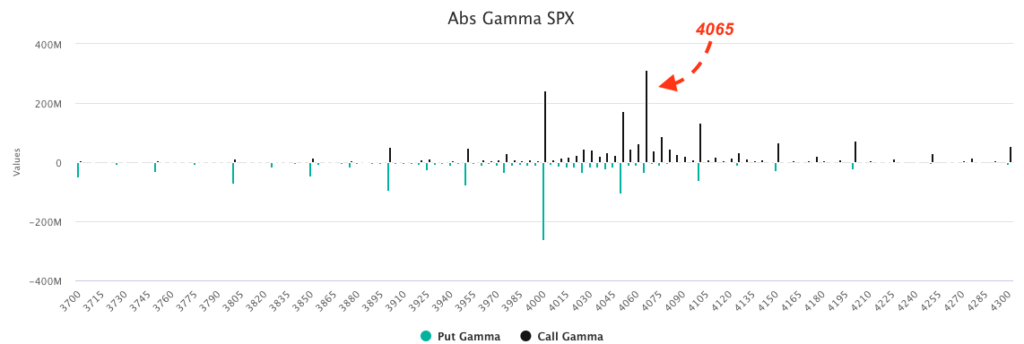
To this point you can now see just how large the gamma is at this 4065 JPM strike, which is a large $300mm vs $50mm just a few days ago (see Wednesdays chart here). Note, though, that this is still smaller than the $400mm SPY 405 gamma. The takeaway here, we believe, is that this creates some sticky upside. This creates a drag to upside movement, which syncs with the performance of recent quarter-ends, as shown above.
Moving on, we continue to face this question of IV compression, with the market pressed up against Call Walls. We want to see calls build at strikes overhead to unlock more upside in markets. On this point, todays SPY Call Wall rolling higher was more of a function of puts being added to 405, vs calls building at 407. Therefore, we are in a bit of a “wait and see” as to how these positions shift for Monday (and they will definitely shift). Further, the IV compression removes the “vanna tailwind” from markets.
Through this lens for upside the market needs to have some “real buyers” to carry us higher, vs the post-bank-crisis options short covering (negative gamma/vanna hedging).
In the end, while the S&P holds 4000 we consider current positioning short term neutral to longer bullish. A break of 4000 likely leads to a sharp move higher in implied volatility, and a quick test of the 3950 area.
We continue to favor some price consolidation to start next week, and we think it will be limited to consolidation into the 4000-3950 area. The exception here would be some type of catalyst (ex: re-emergence of bank issues), which, when combined with IV spike + negative gamma, could quickly push the S&P back into the 3800’s.
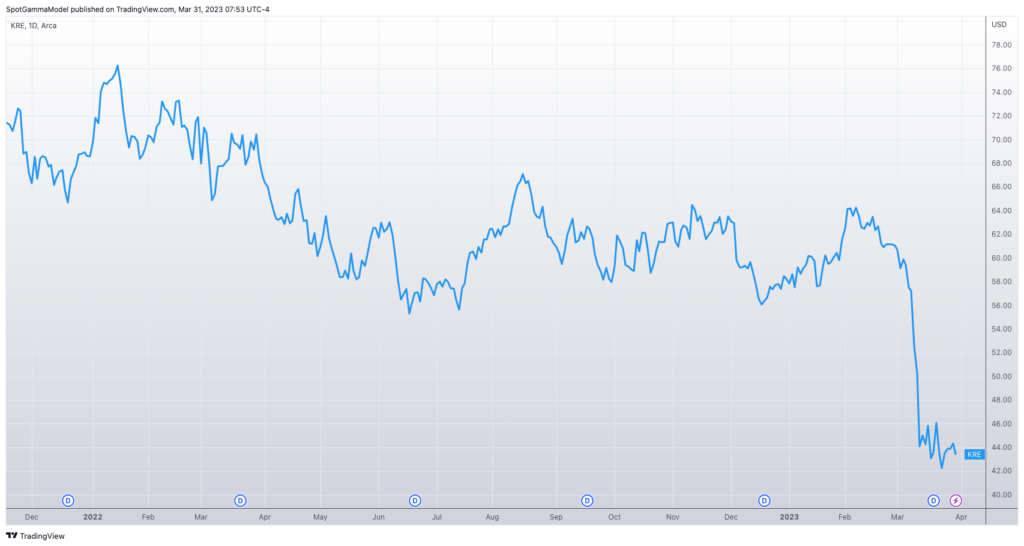
On this point, while we are not bank analysts, we respect price action. These regional banks (KRE plotted below) & brokers (SCHW, JEF, etc) can’t catch a bid which suggests issues are not resolved. This doesn’t have to lead to a huge demand for tail risk, but it may lead to a bounce in IV from current “all clear” levels (see yesterdays AM note).
| SpotGamma Proprietary SPX Levels | Latest Data | SPX Previous | SPY | NDX | QQQ |
|---|---|---|---|---|---|
| Reference Price: | 4048 | 4048 | 403 | 12960 | 315 |
| SG Implied 1-Day Move: | 0.99%, | (±pts): 40.0 | VIX 1 Day Impl. Move:1.2% | ||
| SG Implied 5-Day Move: | 3.01% | 3970 (Monday Reference Price) | Range: 3851.0 | 4091.0 | ||
| SpotGamma Gamma Index™: | 1.33 | 0.78 | -0.09 | 0.04 | 0.02 |
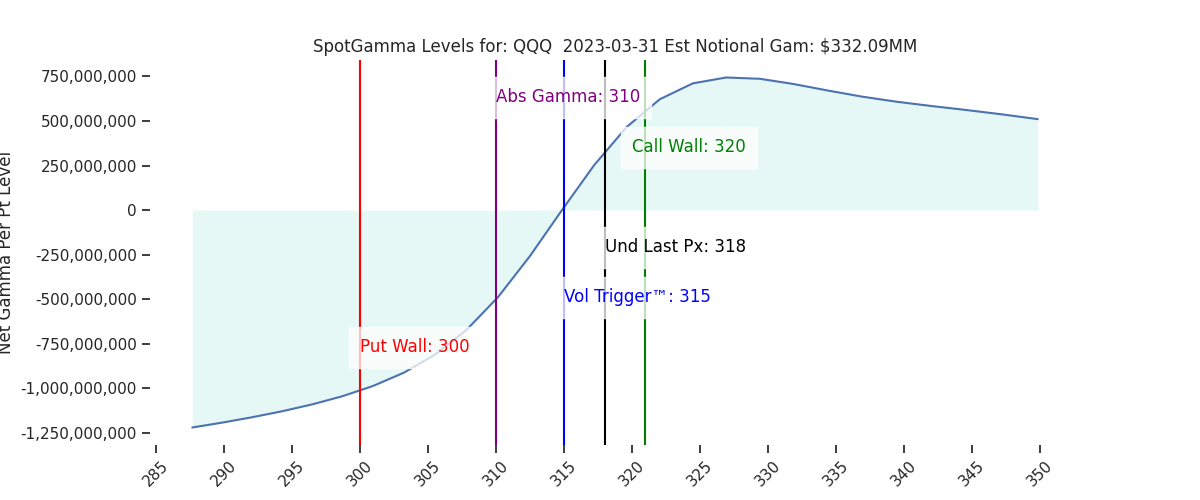
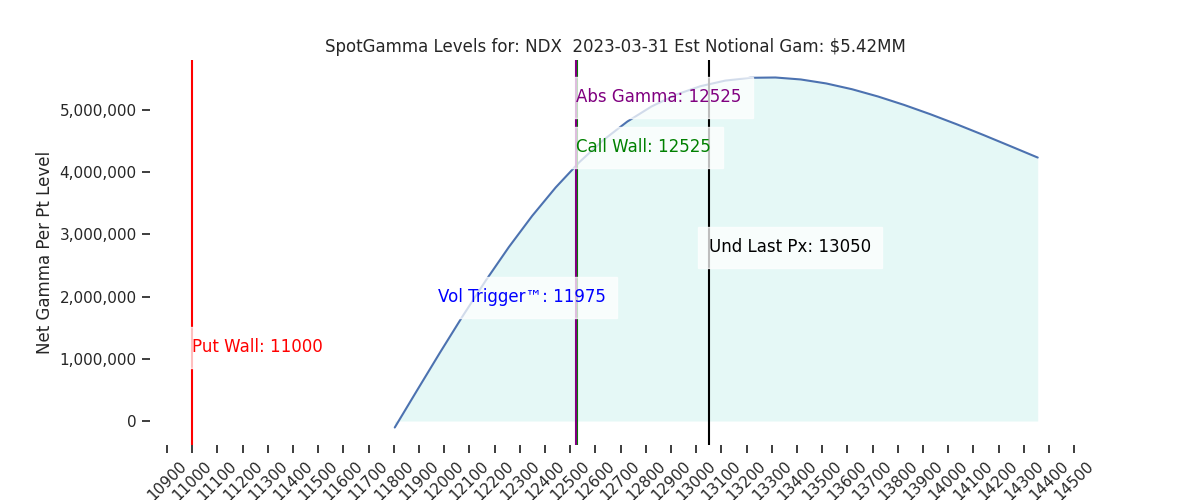
| Volatility Trigger™: | 4000 | 4000 | 402 | 11975 | 315 |
| SpotGamma Absolute Gamma Strike: | 4000 | 4000 | 400 | 12525 | 310 |
| Gamma Notional (MM): | 333.0 | 510.0 | -556.0 | 6.0 | 89.0 |
| Call Wall: | 4065 | 4065 | 407 | 12525 | 320 |
| Put Wall: | 3800 | 3800 | 390 | 11000 | 300 |
| Additional Key Levels | Latest Data | Previous | SPY | NDX | QQQ |
|---|---|---|---|---|---|
| Zero Gamma Level: | 4017 | 4017 | 406.0 | 11752.0 | 336 |
| Gamma Tilt: | 1.36 | 1.29 | 0.87 | 1.74 | 1.05 |
| Delta Neutral Px: | 3984 | ||||
| Net Delta (MM): | $1,274,520 | $1,249,323 | $185,822 | $45,869 | $104,528 |
| 25 Day Risk Reversal: | -0.04 | -0.04 | -0.04 | -0.04 | -0.04 |
| Call Volume: | 534,072 | 565,489 | 2,007,582 | 6,632 | 848,965 |
| Put Volume: | 836,482 | 783,502 | 2,922,290 | 7,853 | 1,332,276 |
| Call Open Interest: | 5,575,305 | 5,510,436 | 6,884,645 | 50,850 | 4,823,407 |
| Put Open Interest: | 10,794,809 | 10,658,829 | 14,145,409 | 54,459 | 8,867,162 |
| Key Support & Resistance Strikes: |
|---|
| SPX: [4100, 4065, 4050, 4000] |
| SPY: [405, 403, 402, 400] |
| QQQ: [320, 315, 310, 300] |
| NDX: [14000, 13000, 12525, 12000] |
| SPX Combo (Strike, Percentile): [(4247.0, 86.02), (4198.0, 94.41), (4174.0, 78.77), (4145.0, 91.74), (4121.0, 86.57), (4113.0, 80.69), (4109.0, 77.61), (4097.0, 96.93), (4093.0, 86.02), (4089.0, 80.6), (4081.0, 93.21), (4077.0, 91.99), (4072.0, 98.19), (4068.0, 90.52), (4060.0, 99.98), (4056.0, 95.05), (4052.0, 93.08), (4048.0, 96.5), (4028.0, 84.58), (3996.0, 84.01), (3959.0, 80.44), (3947.0, 89.61), (3911.0, 83.11), (3898.0, 94.22), (3862.0, 78.41)] |
| SPY Combo: [404.91, 406.12, 408.54, 403.7, 404.51] |
| NDX Combo: [13259.0, 12637.0, 13052.0, 13013.0, 12430.0] |