Macro Theme:
Major Resistance: $4,200
Pivot Level: $4,150
Critical Support: $4,000
Range High: $4,200 Call Wall
Range Low: $3,800 Put Wall
‣ $4,200 is likely heavy resistance into April 21st OPEX
‣ High market volatility is unlikely with SPX >$4,000 due to positive gamma positioning.
‣ 1 Month IV is at lows near 16%, which is likely a long term low which reduces equity vanna tailwinds. It further implies that longer dated IV may be reasonably priced.
Market Events | Estimated Earnings Dates
Wednesday, April 19 (before market open): MS earnings
Wednesday, April 19 (after market close): TSLA earnings
Friday, April 21 (monthly opex)
Tuesday, April 25 (after market close): GOOGL, MSFT, V earnings
Wednesday, April 26 (after market close): META earnings
Thursday, April 27 (before market open): MA earnings
Thursday, April 27 (after market close): AMZN earnings
Thursday, May 4 (after market close): AAPL earnings
What’s Happening in the Market
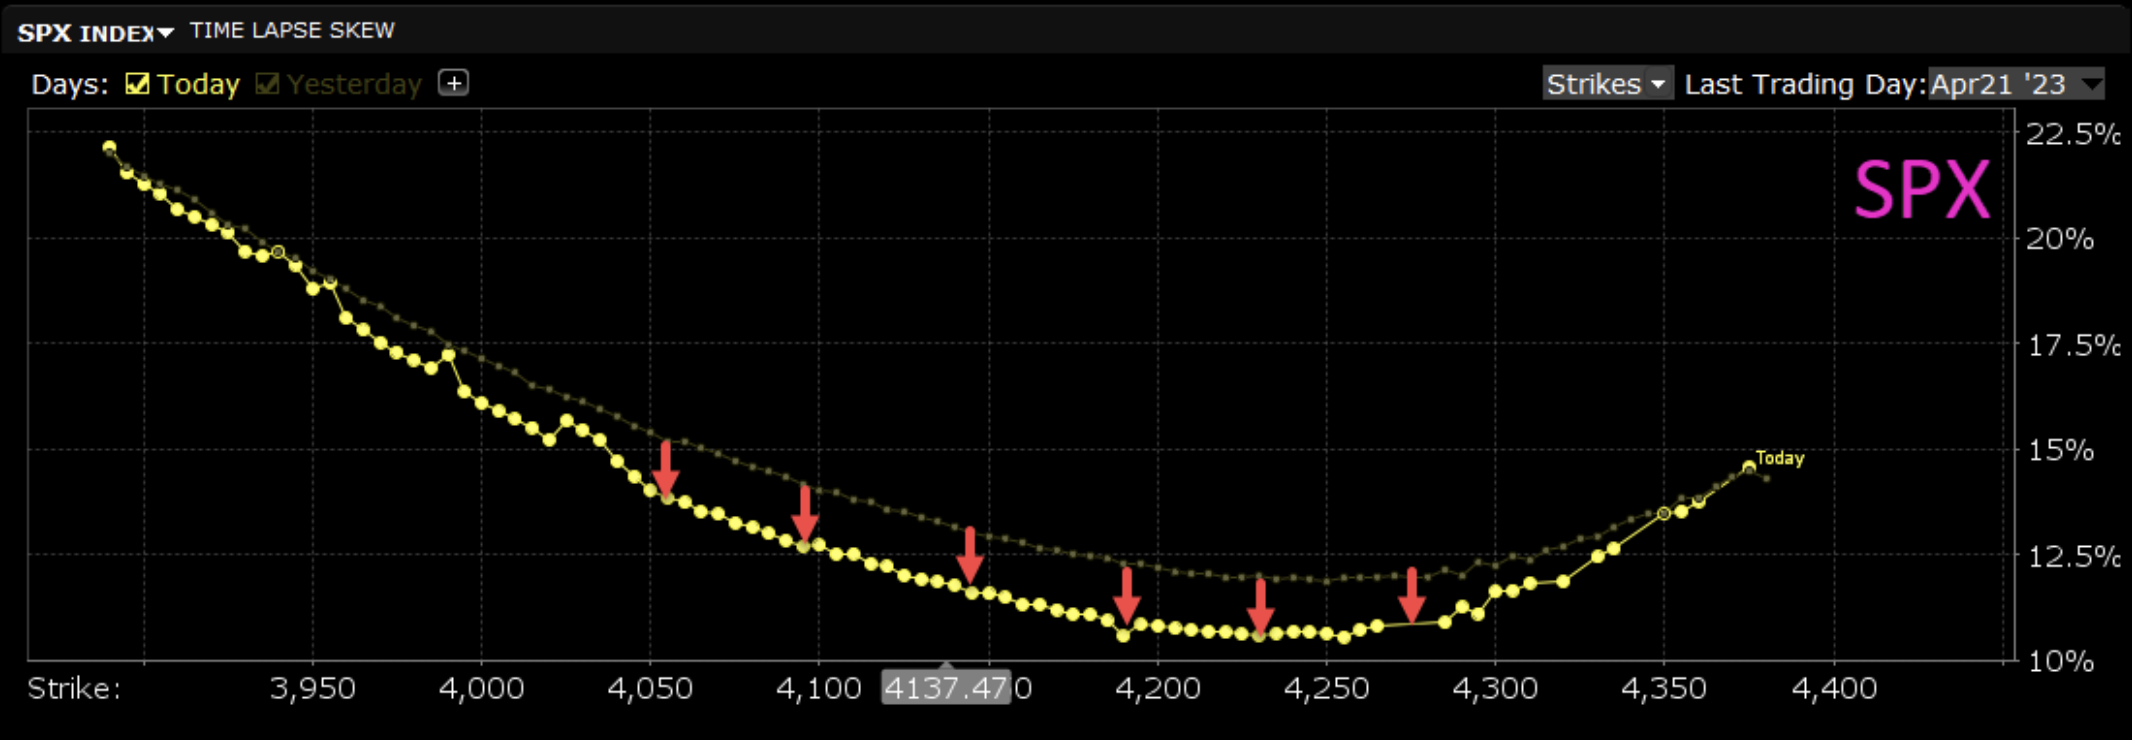
Equities dipped today but then recovered to be nearly perfectly net flat on the day. Even at the worst of the selling, the VIX was still red on the day. Those holding puts with expert timing were barely able to monetize their puts at the low of the day for scraps. And then when equities bounced off of lows (driven by long calls), the crushing of the VIX ramped up. The VIX closed today at 17.10, which is near that 16 baseline we recently pointed out as a near-term historical low accompanying the 4150 SPX level. Overall, the entire volatility smile floated down today, especially near the center (near the money). Pictured here is the April opex next Friday:
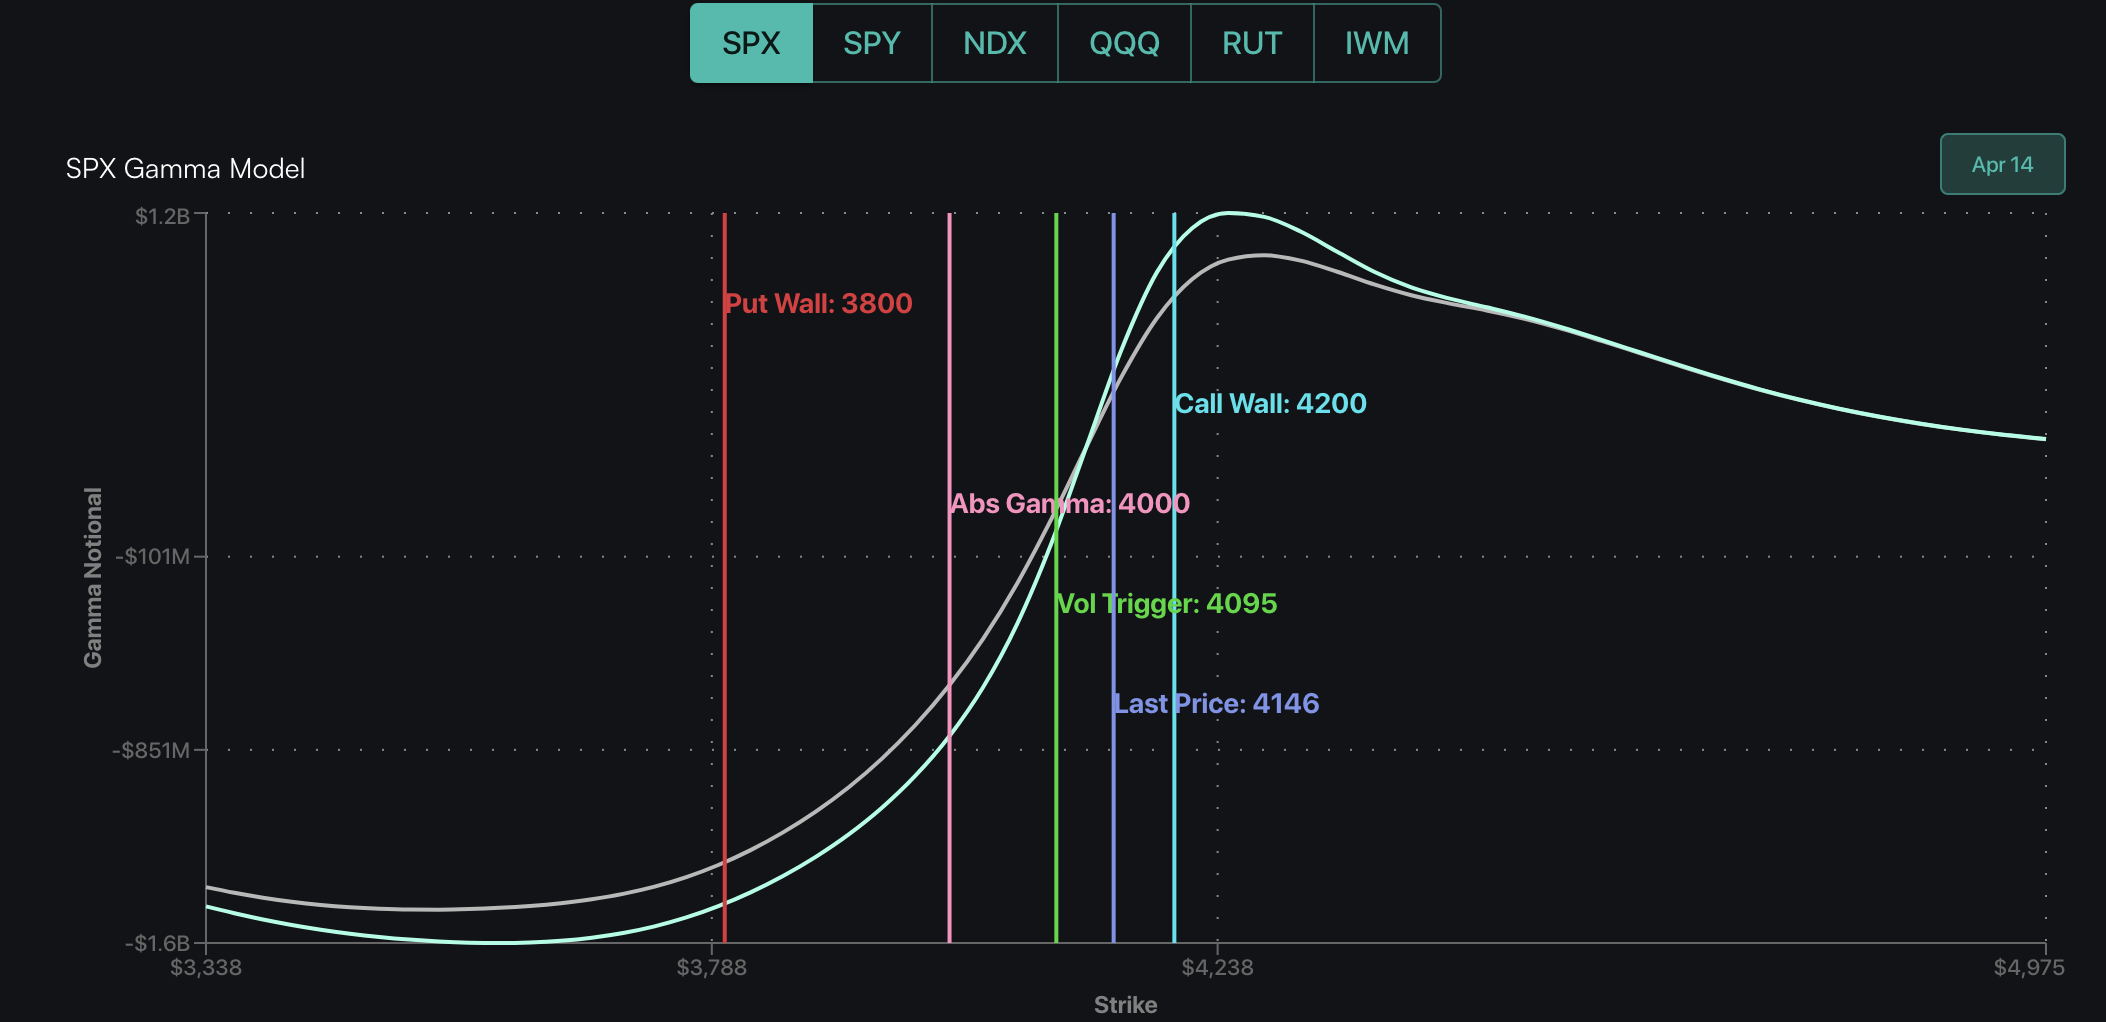
Regarding market structure, the SPX Call Wall held for a 6th day in a row but its Put Wall dropped back down to 3800. This is consistent with the long strangle flows we continued to see on the S&P 500 complex (via HIRO) as opportunists have been scooping up surrendered options at low impact. The result of this new floor at 3800 is a wider implied range for the market, especially if this level holds into tomorrow. If it does, we will take a close look at what is causing these levels and report back with updates.
How is it that the VIX is able to crush this low? Let’s review.
1) We are approaching April opex (exactly one week from now) and are in a mostly neutral market gamma environment. This means the market is without interference from the low liquidity which accompanies strongly negative market gamma regimes and enables the price to move easily in a relatively wide range.
2) Exotics offer alternatives for major institutions and also our European retail friends who have access to them. Instead of buying vanilla puts, they can buy exotics such as barrier options which offer cheaper hedging protection. As an example of what that can look like, a barrier put could have a strike of 3900 but a knock-in price of 3800. The knock-in put would not become activated unless the price drops below 3800, and then it would be like having a put all along with a 3900 strike. If financial institutions know that they would be willing to hold onto puts as they move that far in the money, then they will trade exotic products like these; this means less vanilla options used on SPX which means a drop in the VIX.
3) Low leverage consumption: When investors are positioned only lightly to the upside then they are not as interested in dragging long puts. This lack of demand lowers the VIX. One of the major reasons why positioning is so low is because the cost of margin is very high compared to where it was a couple years ago.
4) Dominance of covered short put strategies: Last year covered short puts did very well. This is a defined-risk strategy where traders are short the underlying security and also short puts; it is the opposite of a covered call and it is volatility killing. Days like today reward this strategy since traders can short the underlying and also benefit from implied volatility decreasing on their short puts.
5) Structurally we are in a tight range, which is also volatility killing; however, SPX’s Put Wall did open the new floor to 3800 today, down from 3900 yesterday.
Gamma Spotlight
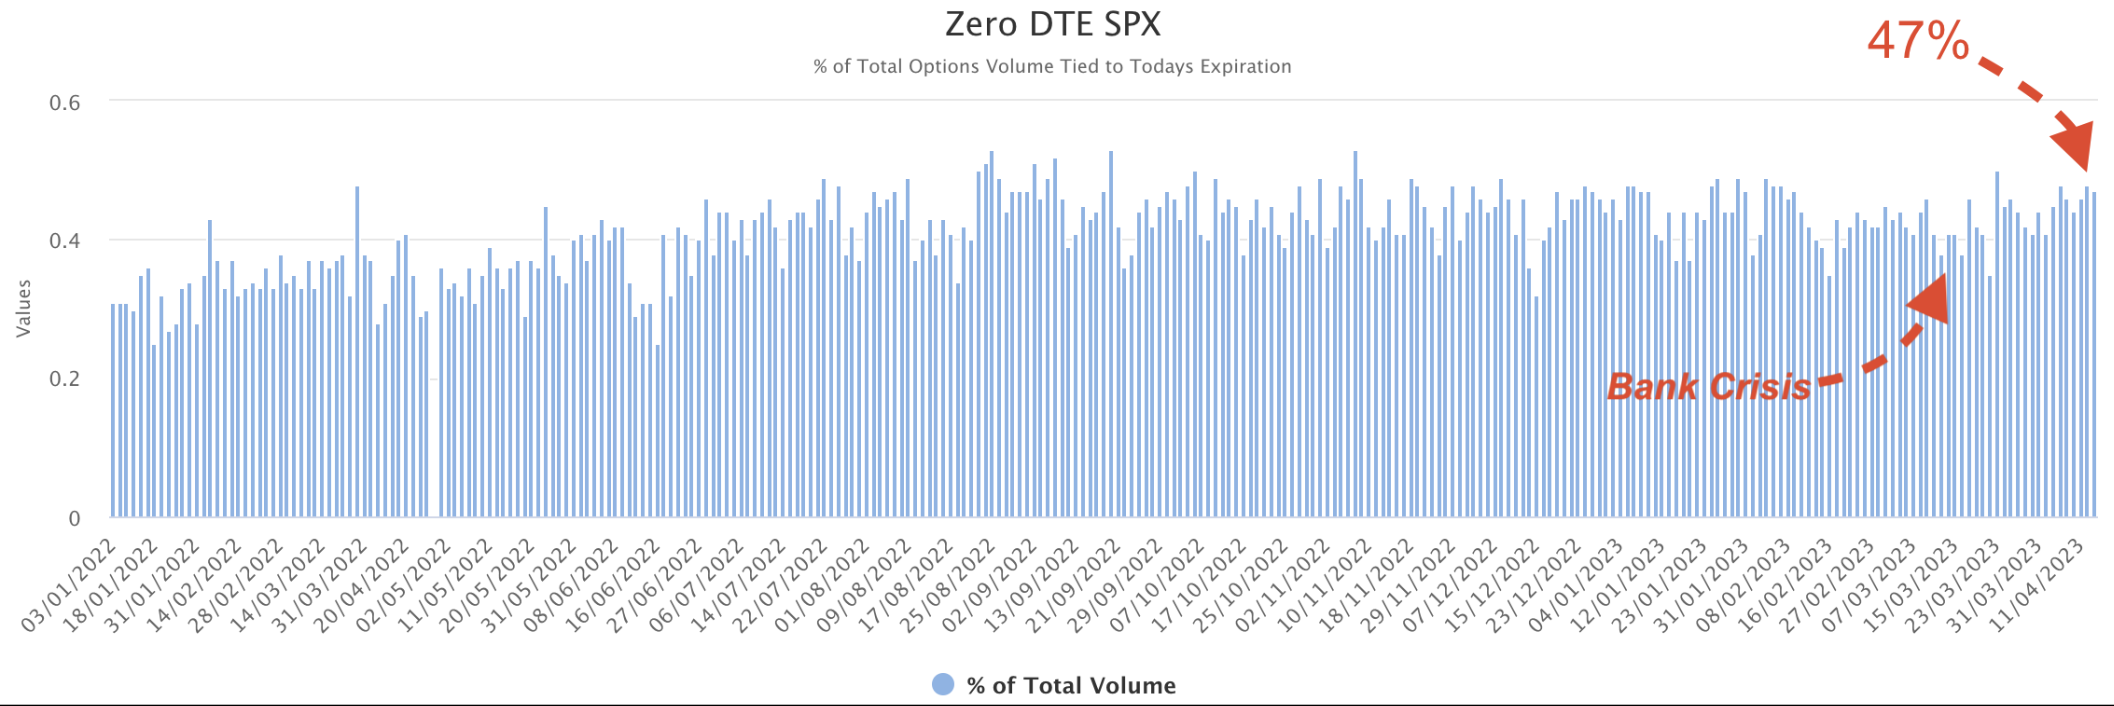
On Twitter today, we highlighted an emerging phenomenon where zero DTE volume appears to be coming in stronger as we enter a lower implied volatility regime. There is not yet enough long-term data to support this thesis, but it is compelling, and it passes the commonsense test that institutions might be emboldened to take on heavier ultra-short-term bets if volatility is lower.
Hedging Impact
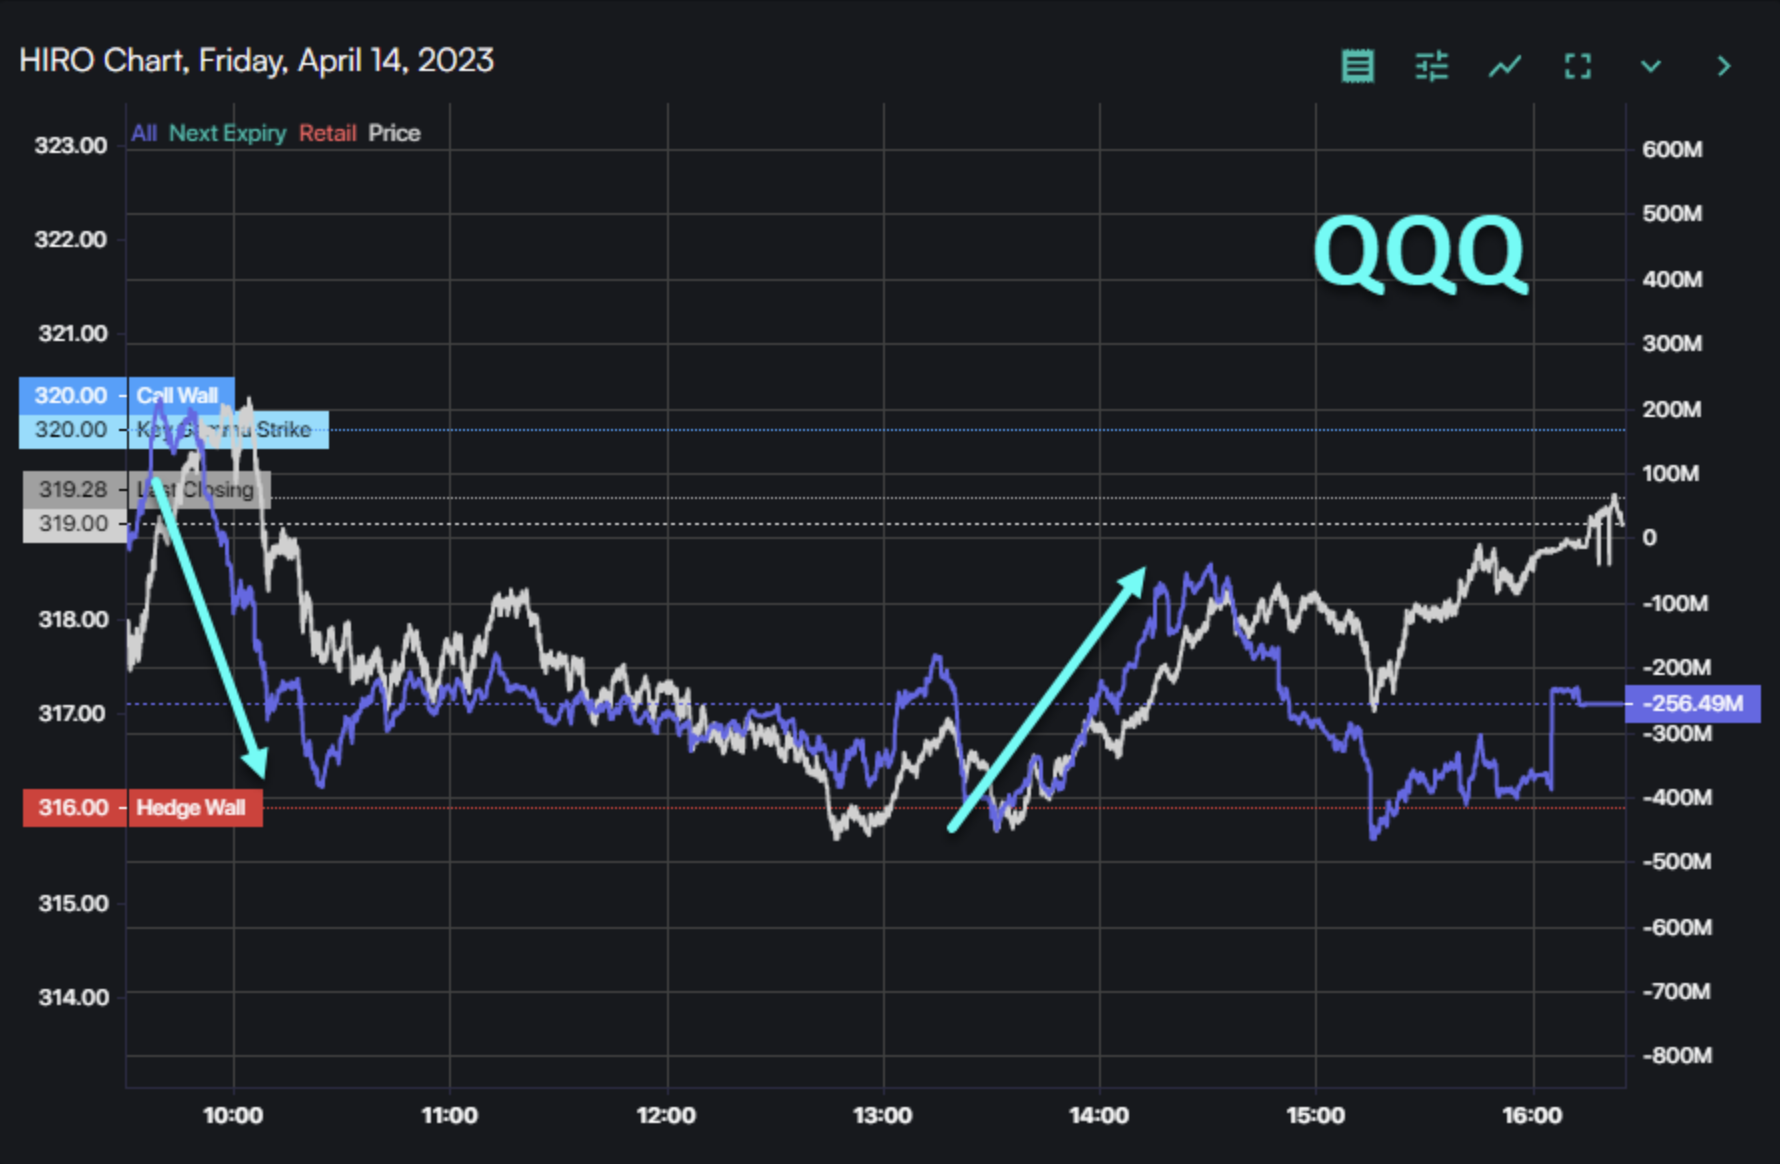
QQQ total option flow (shown in purple) sharply cut down across the initial rally today on QQQ shares, and the spot price followed it down until 1pm EST. Then, QQQ option flow moved up sharply at 1:30pm EST, and QQQ shares rallied for the rest of the day, fully recovering from the d
Market Structure
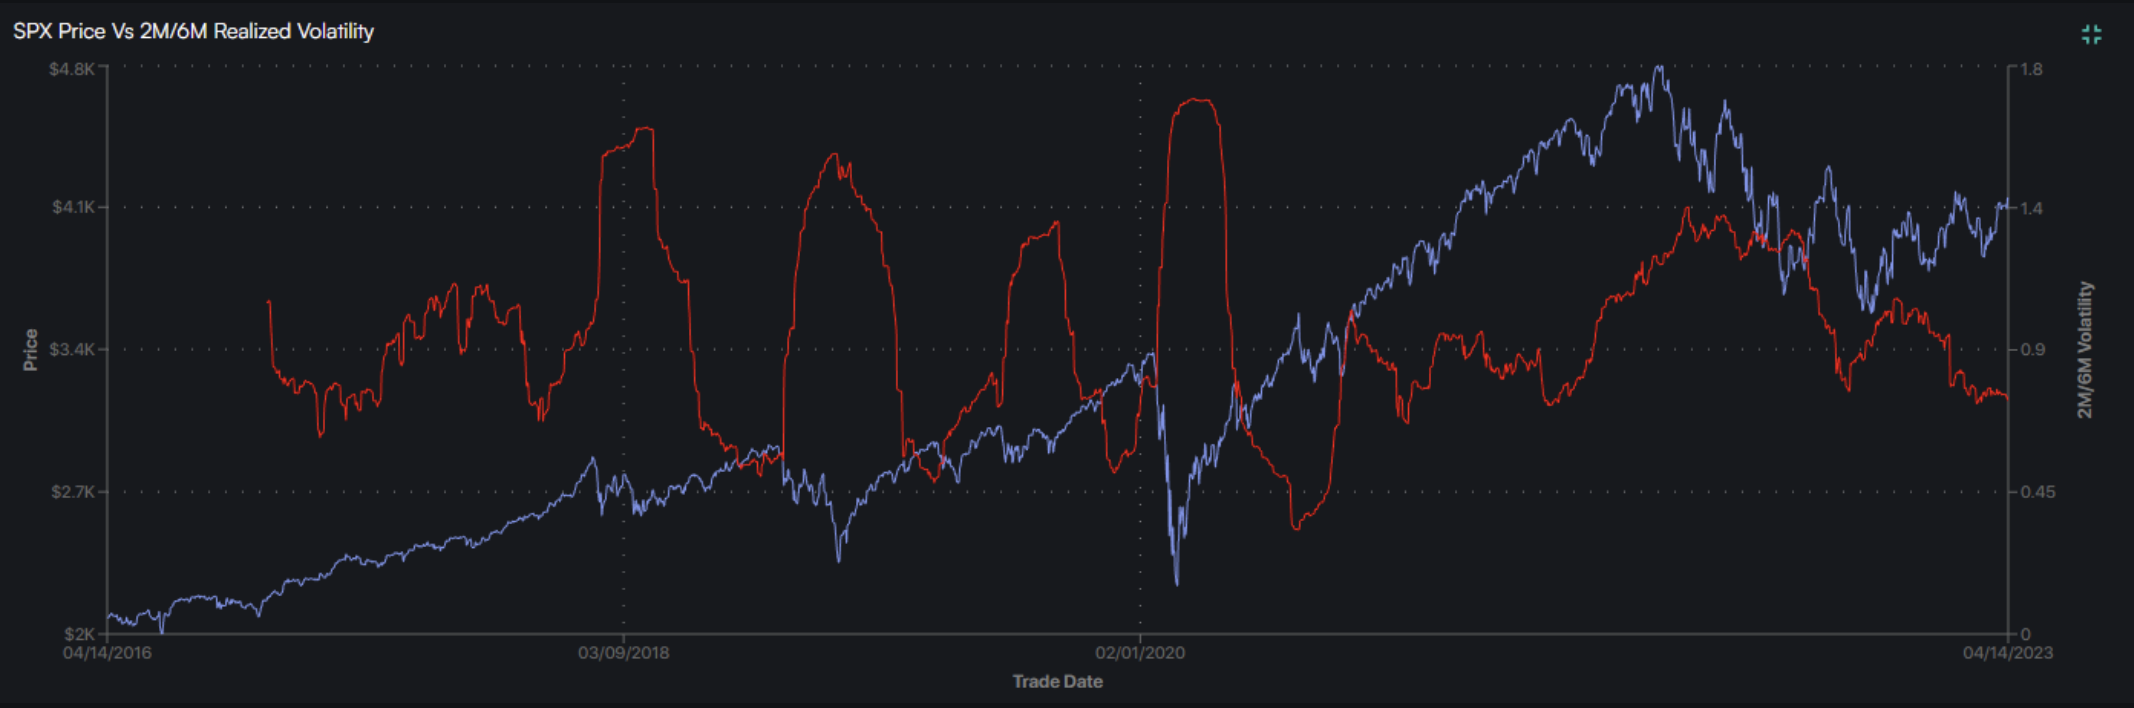
To quote research from Milliman Financial (2018), “The VIX is a measure of implied volatility, but most VC [volatility controlled] fund models are based on some measure of realized volatility. The two often rise and fall together, but need not necessarily do so and are known to deviate from time to time.” This is an important distinction to be aware of, in how these volatility controlled funds (such as pensions and annuities) tend to be responsive to RV (realized volatility) since it is not always in sync with implied volatility.
This is the main idea we had in mind when we added a couple realized volatility tools to the Indices dashboard. Let’s take a look at those. As Milliman alluded to in their research, not all of these volatility-controlled funds approach RV in the same way. However, one of the primary and commonsense approaches that they focus on is to compare some measure of short-term RV to long-term RV. We do that for you here by tracking the ratio of 2-month RV to 6-month RV (red line). When this figure is low, then it means short term RV is dominating to the downside (decreasing). And when this figure is high, it means that RV is dominating to the upside (increasing).
As a refresher on the different types of volatility, you can refer to our articles on these subjects: volatility, realized volatility, implied volatility, forward implied volatility, and skew.
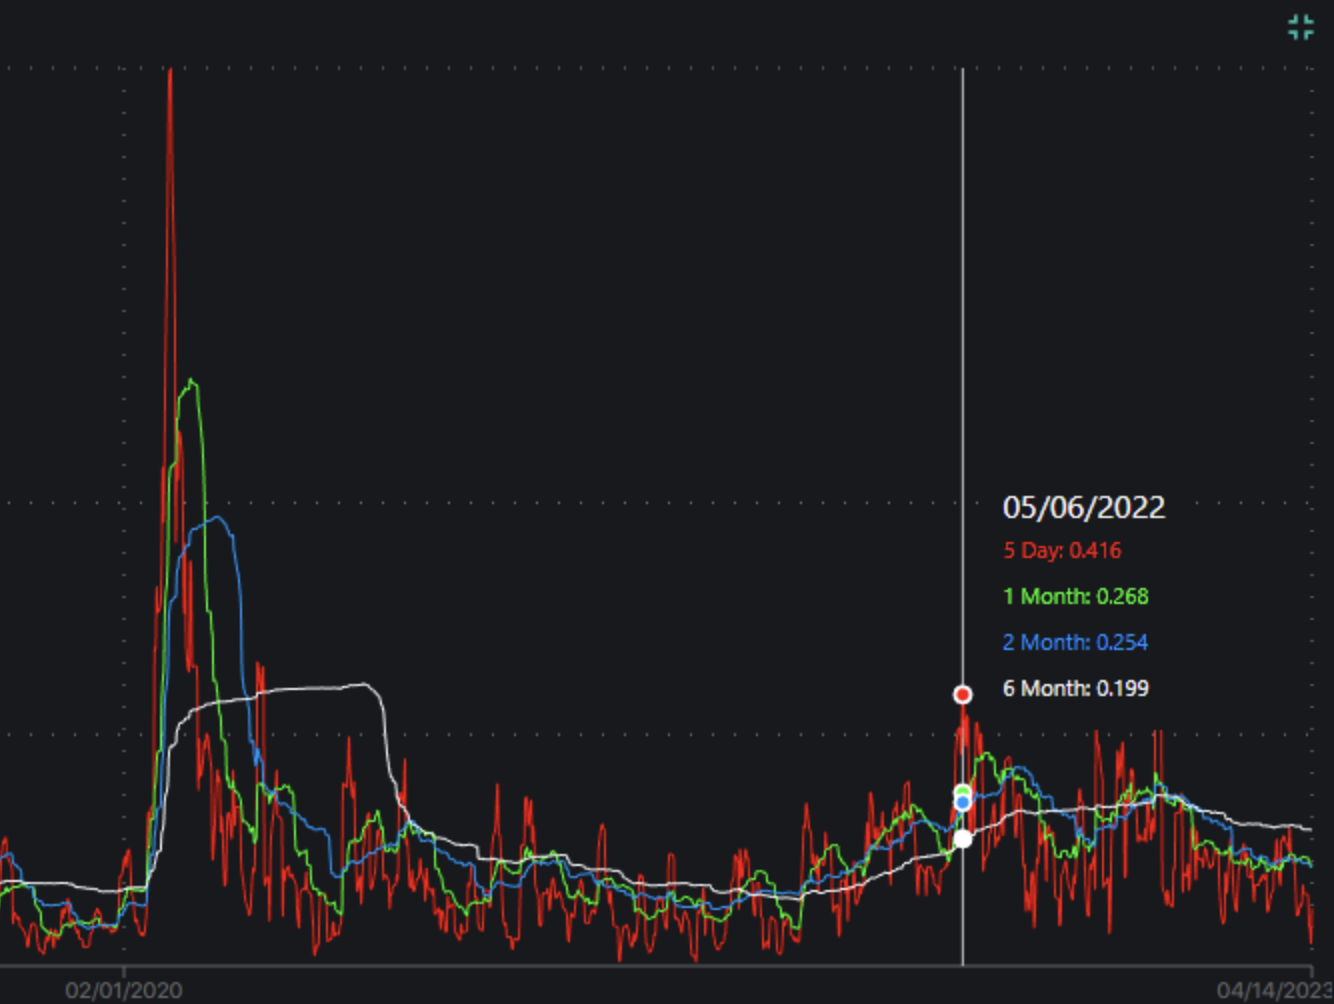
Another view we provide is comparing 5-day, 1-month, 2-month, and 6-month realized volatility of SPX all in one chart so that you can make your own extrapolations. But the bottom line here, which creates a tough case for the bulls, is that since RV is mostly restricted to moving up from here (especially short-term RV) then this creates a [bearish] headwind for the market. This is because many of these volatility-controlled funds would be selling as RV bounces back up, even if that RV is from a series of sharp rallies.
Conclusion
MSFT’s schedule was shifted to Tuesday, April 25 (after market close). That makes this arguably the biggest date now with GOOGL, MSFT, and V reporting all at once. We cross-reference these earnings events across multiple sources, but please keep in mind that the speculated dates generally shift when approaching the actual earnings weeks, and official sources tend to estimate earnings dates based on historical patterns. If about to make an earnings trade, it is a good idea to double-check an official source such as NASDAQ. These projections tend to change as official information rolls out directly from the companies, and it is painful to lose money on an earnings trade because you have the wrong date.
Take care heading into earnings season. As you plan, mind your size and know what your worst-case scenarios are and know that you would be able to withstand the unexpected. One trap to look out for is to avoid hitting extra hard with premium selling just because implied volatility is running on the historically low side.
| SpotGamma Proprietary Levels | SPX | SPY | NDX | QQQ | RUT | IWM |
|---|---|---|---|---|---|---|
| Reference Price: | $4146 | $413 | $13109 | $319 | $1796 | $178 |
| SpotGamma Implied 1-Day Move: | 0.94% | 0.94% |
|
|
|
|
| SpotGamma Implied 5-Day Move: | 2.69% |
|
|
|
|
|
| SpotGamma Volatility Trigger™: | $4095 | $411 | $12520 | $316 | $1900 | $177 |
| Absolute Gamma Strike: | $4000 | $410 | $13000 | $320 | $1800 | $180 |
| SpotGamma Call Wall: | $4200 | $415 | $12525 | $320 | $1735 | $178 |
| SpotGamma Put Wall: | $3800 | $400 | $11000 | $300 | $1750 | $170 |
| Additional Key Levels | SPX | SPY | NDX | QQQ | RUT | IWM |
|---|---|---|---|---|---|---|
| Zero Gamma Level: | $4227 | $411 | $12552 | $347 | $1762 | $205 |
| Gamma Tilt | 1.5 | 1 | 1.6 | 1.2 | 0.66 | 0.62 |
| SpotGamma Gamma Index™: | 1.8 | 0.016 | 0.036 | 0.046 | -0.022 | -0.067 |
| Gamma Notional (MM): | $4.3B | $8B | $25M | $3.5B | $121M | $3.1B |
| 25D Risk Reversal | -5.47% | -4.62% | -5.34% | -5.49% | -4.52% | -4.93% |
| Call Volume: | 558K | 1.9M | 9.2K | 614K | 37K | 196K |
| Put Volume: | 836K | 2.9M | 9.2K | 1M | 47K | 457K |
| Call Open Interest: | 6.1M | 7M | 54K | 4.7M | 174K | 3.3M |
| Put Open Interest: | 12M | 14M | 64K | 8.3M | 334K | 7.4M |
| Key Support & Resistance Strikes |
|---|
| SPX Levels [4200, 4150, 4100, 4000] |
| SPY Levels [420, 415, 412, 410] |
| NDX Levels [14000, 13200, 13000, 12525] |
| QQQ Levels [320, 317, 315, 310] |
| SPX Combos: [(4349,89.94), (4325,78.10), (4320,87.69), (4300,97.94), (4291,76.46), (4275,90.23), (4271,75.00), (4250,97.17), (4225,88.22), (4221,79.07), (4213,84.73), (4208,85.92), (4200,99.57), (4192,95.50), (4184,89.78), (4179,87.44), (4175,97.83), (4171,94.66), (4167,87.94), (4163,86.32), (4159,94.55), (4155,86.04), (4150,99.03), (4146,77.69), (4138,83.99), (4130,89.67), (4125,86.32), (4051,78.98), (4009,80.21), (4001,89.29), (3951,86.02)] |
| SPY Combos: [418.66, 413.76, 388.87, 408.87] |
| NDX Combos: [13136, 13345, 13555, 13227] |
| QQQ Combos: [305.21, 319.93, 299.89, 324.94] |