Macro Theme:
Major Resistance: $4,200
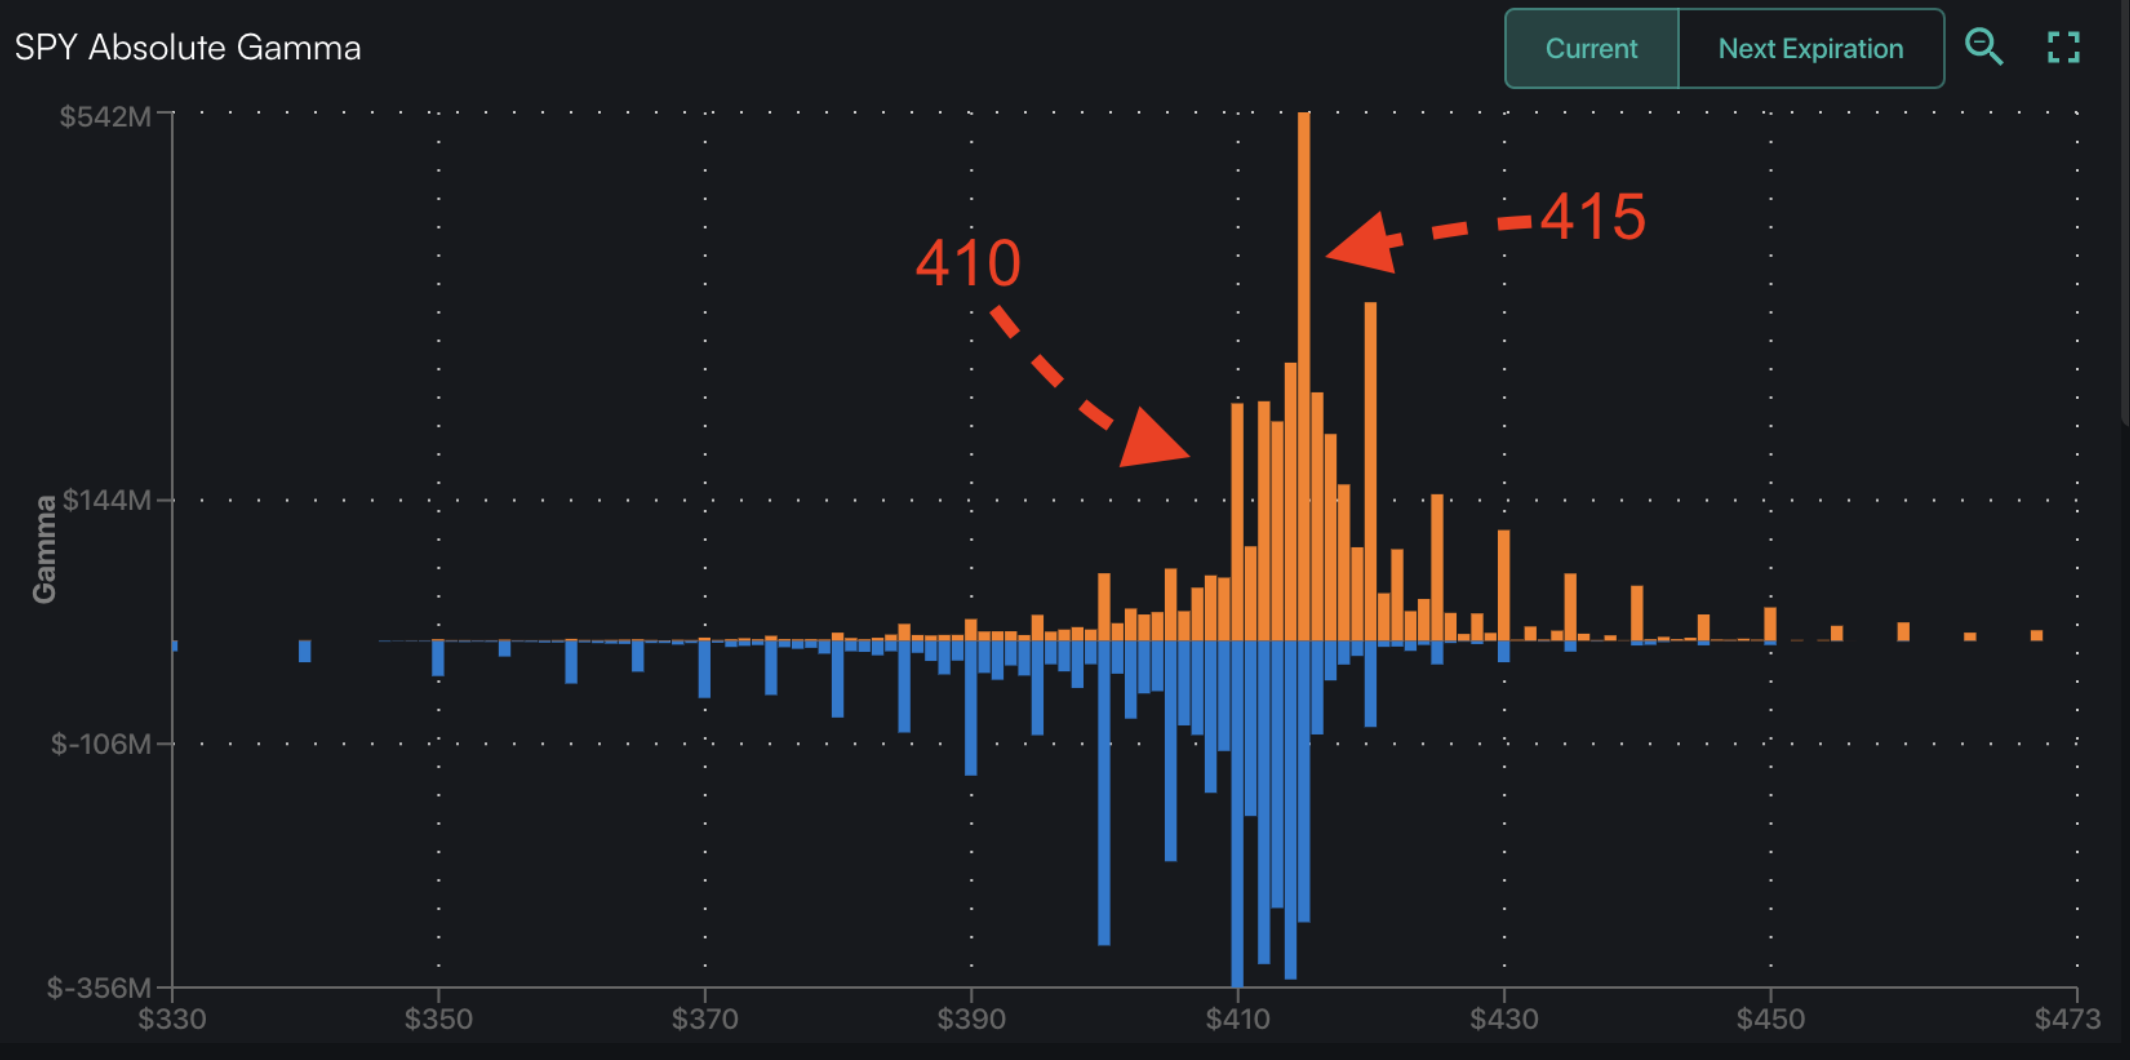
Interim Resistance: $4,150 – 4160 (SPY 415)
Pivot Level: $4,100
Critical Support: $4,000
Range High: $4,200 Call Wall
Range Low: $3,900 Put Wall
‣ $4,200 is likely heavy resistance into April 21st OPEX
‣ We look for markets to consolidate after OPEX & heading into the 5/3 FOMC
‣ 1 Month IV is at lows near 16%, which is likely a long term low which reduces equity vanna tailwinds. It further implies that longer dated IV may be reasonably priced.
Founder’s Note:
Events Today:
META Trade Study, Analysis, and Q&A
Join pro trader and SpotGamma contributor, Doug Pless, for a breakdown of a recent trade in META featuring the Call Wall and multiple SpotGamma tools, all inside the new interface.
>> Live at 10:00 AM ET
Top 50 Stocks Into April OpEx
Join our founder, Brent Kochuba, for a quick take on the top names with the highest potential to move after April options expiration.
>> Live at 1:00 PM ET
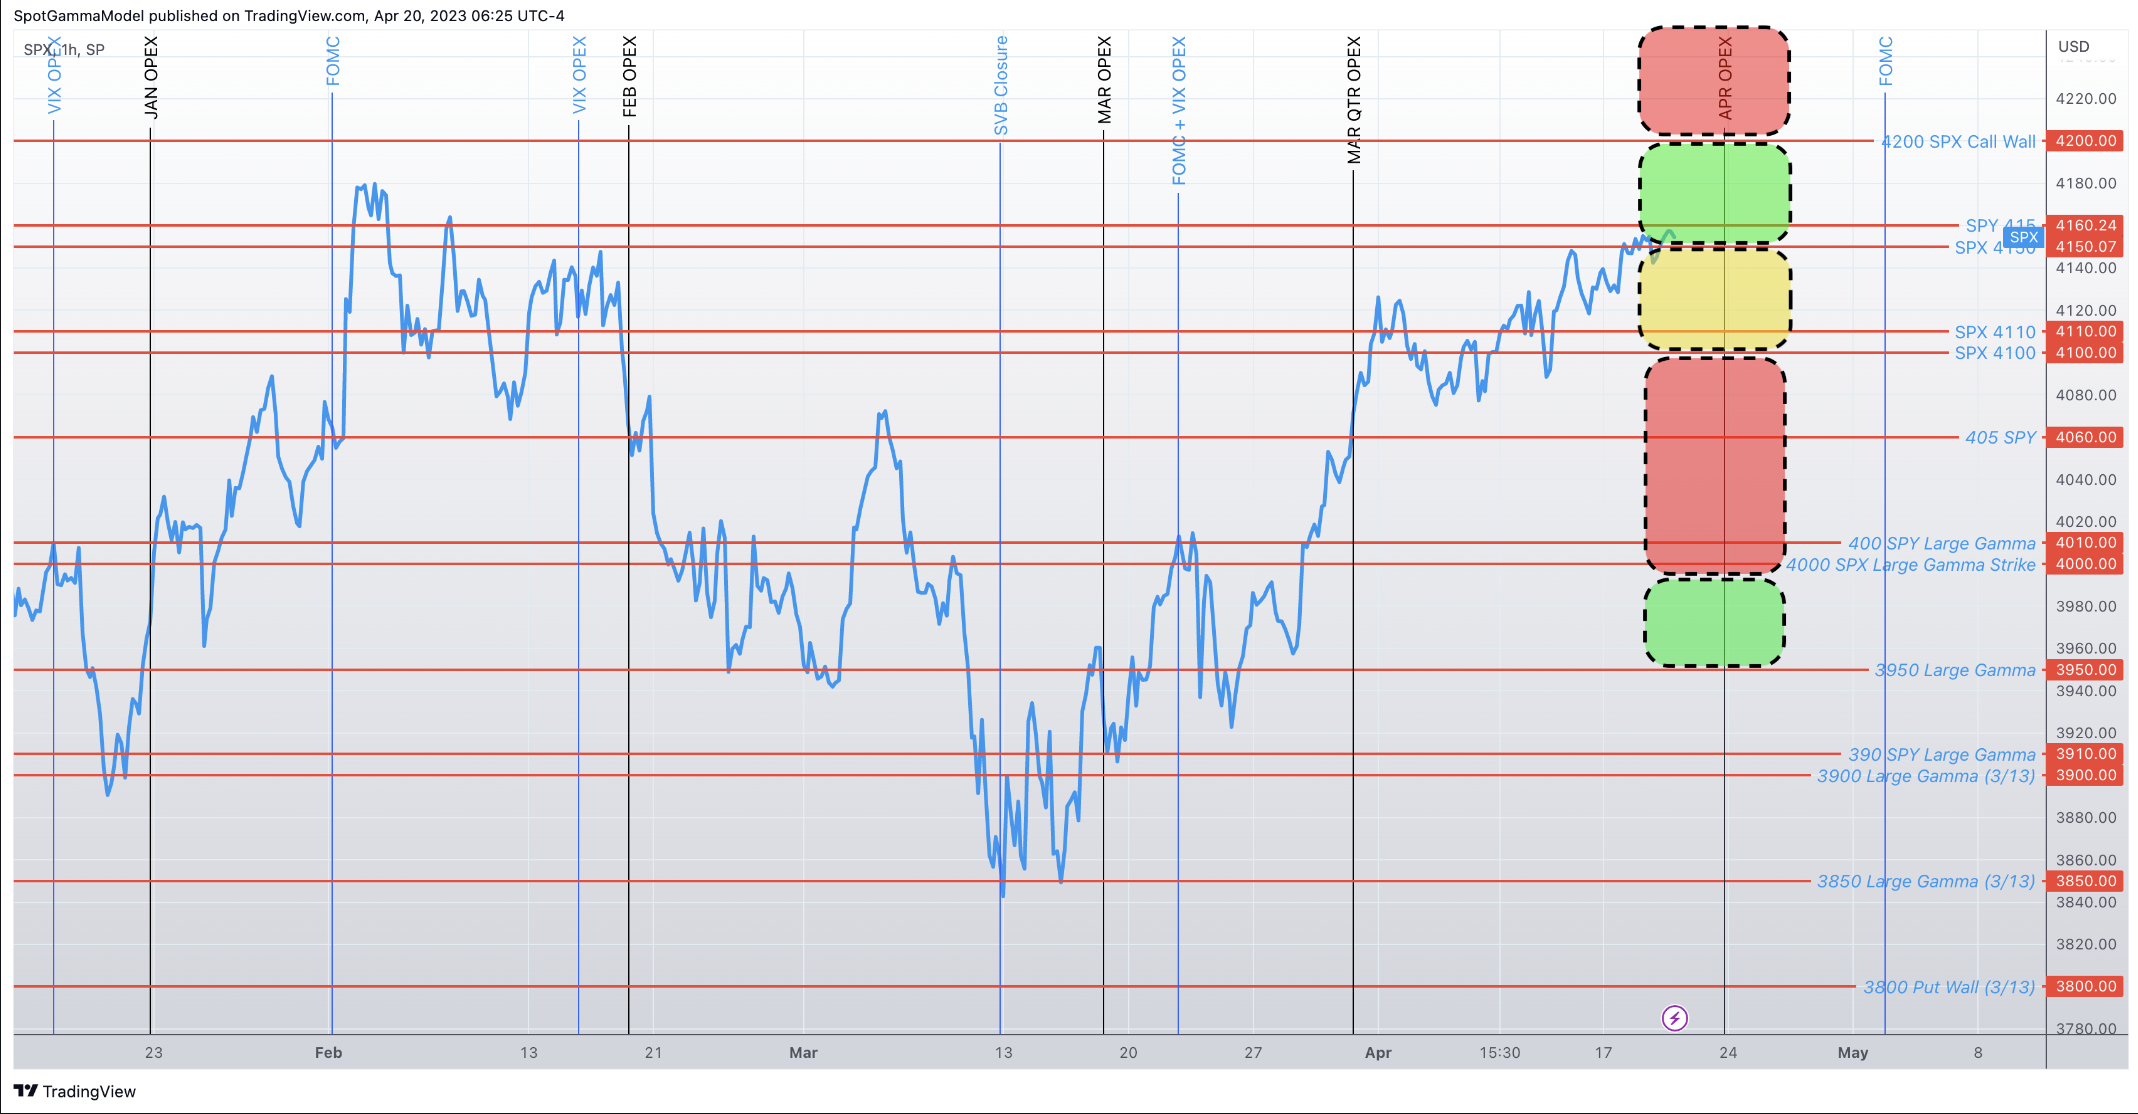
Futures are off 50bps to 4140. Earnings are in focus, with TSLA down 20% premarket. Initial, strong support shows at 4110 (SPY 410) – 4100. Lighter support shows below at 4075. Resistance above appears at several levels; 412 SPY (4130 SPX), 413 SPY (4140 SPX), 4150 SPX & then a very large 415 SPY (4160).
These upside levels should be seen as a resistance band or zone from 4125-4160 which serve to slow or reduce volatility. Both 4150 SPX & 415 SPY are of particular significance as a resistance line into Friday. Should we break below 4100, the positive gamma support reduces and the chances of a 4000 test for next week increase.
In line with our last several notes (here, here), we continue to look for consolidation in equity prices next week, with eyes then turning to 5/3 FOMC. With implied volatility so low, any quick normalization of IV would likely add to selling pressure which fuels a possible move down to 4000. 400 SPY & 4000 SPX are very large support lines, and we would anticipate markets bouncing there. For today we assign edge to 4100 holding, but in our view it may only offer a mild bounce.
Conversely, should the SPX close up over 4150 (SPY 415), we would then look for a test of the 4200 Call Wall and this holds true into next week.
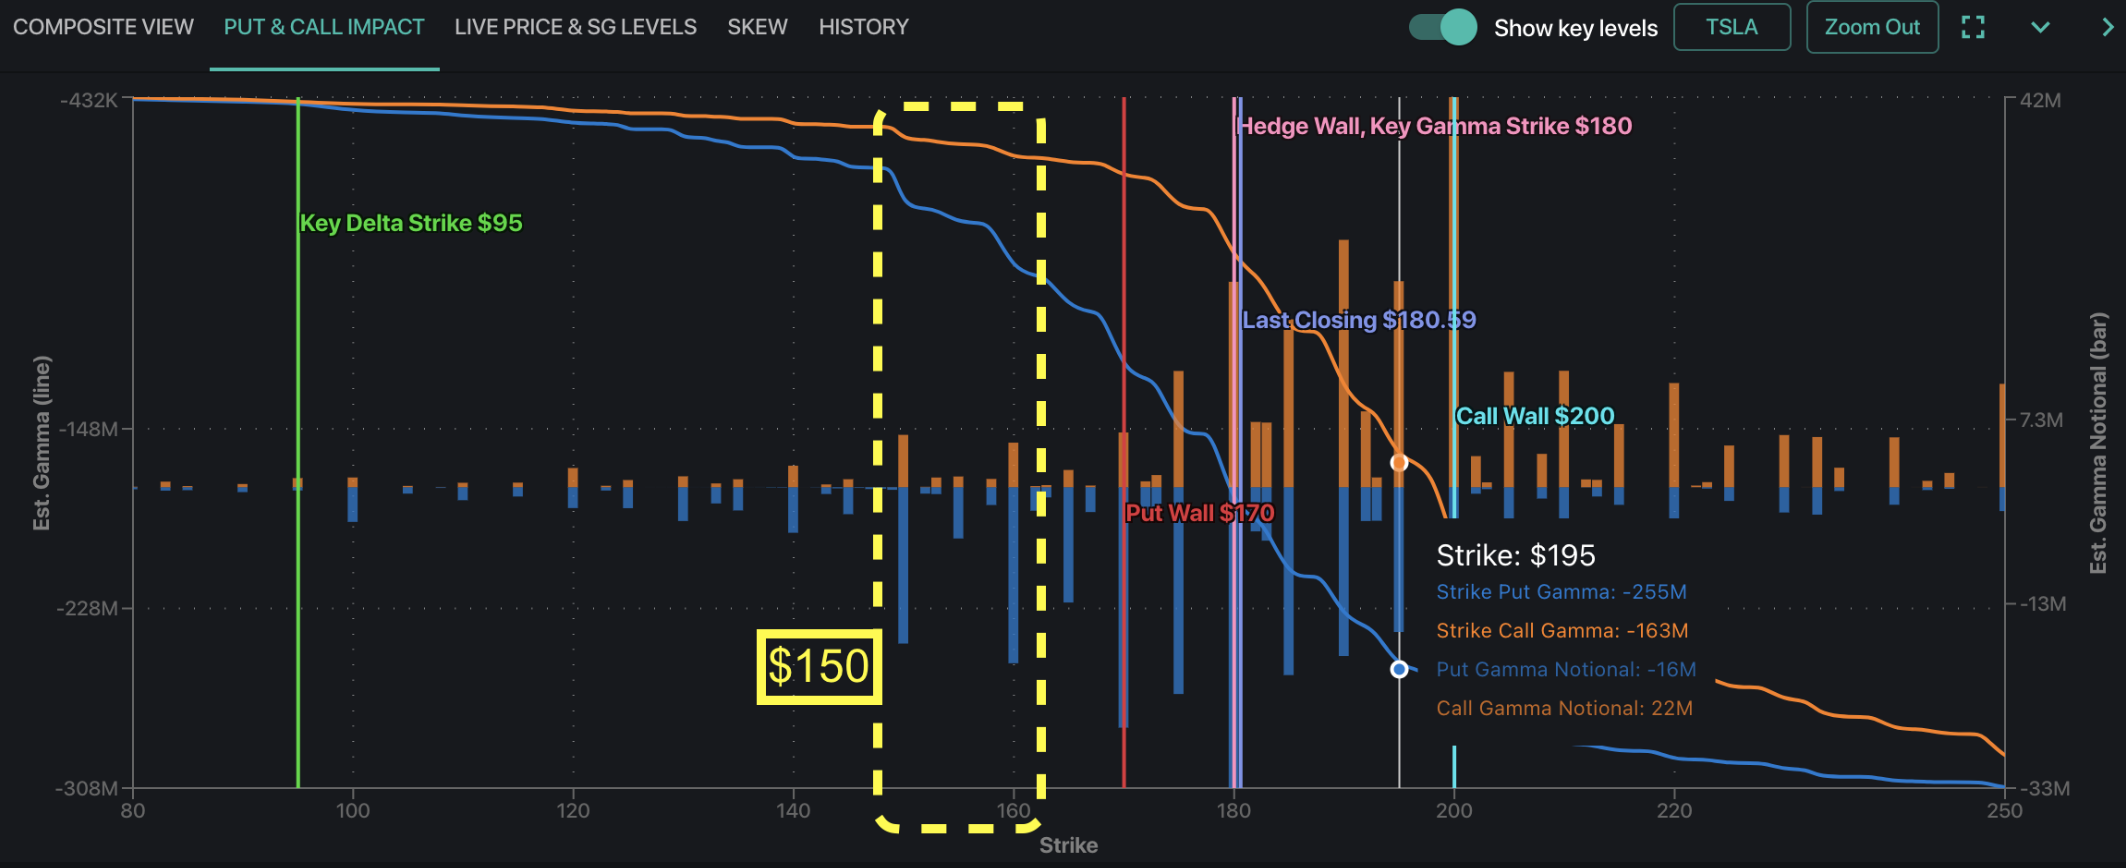
For those of you active in TSLA, the stock is now rather stretched to the downside. There is a fair amount of positioning at $160, with $150 being the last line of any real open interest. The stock should find some support in the $150-$160 area (should it test that area). You can see these levels as strikes with large put interest (blue vertical bars) highlighted in the yellow box. From the volatility perspective it’s a more interesting play.
Note the two curves on the charts: call gamma (orange) & put gamma (blue). You may note that these curves start to flatten out significantly through the yellow box, and are nearly horizontal <$150. As these gamma lines flatten out it implies that gamma hedging should subside because most put options are deep in the money (delta is approaching 1). This suggests options induced downside pressure (i.e. realized vol) should reduce in this $150-$160 price area. See this previous video on WMT to dig into this concept.
| SpotGamma Proprietary Levels | SPX | SPY | NDX | QQQ | RUT | IWM |
|---|---|---|---|---|---|---|
| Reference Price: | $4154 | $414 | $13088 | $318 | $1799 | $178 |
| SpotGamma Implied 1-Day Move: | 0.87% | 0.87% |
|
|
|
|
| SpotGamma Implied 5-Day Move: | 2.71% |
|
|
|
|
|
| SpotGamma Volatility Trigger™: | $4135 | $414 | $12910 | $319 | $1800 | $180 |
| Absolute Gamma Strike: | $4150 | $415 | $13000 | $320 | $1800 | $180 |
| SpotGamma Call Wall: | $4200 | $420 | $13000 | $320 | $1805 | $182 |
| SpotGamma Put Wall: | $4000 | $400 | $11000 | $315 | $1750 | $170 |
| Additional Key Levels | SPX | SPY | NDX | QQQ | RUT | IWM |
|---|---|---|---|---|---|---|
| Zero Gamma Level: | $4099 | $413 | $12109 | $316 | $1892 | $182 |
| Gamma Tilt: | 1.3 | 0.93 | 1.3 | 1.1 | 0.66 | 0.62 |
| SpotGamma Gamma Index™: | 1.3 | -0.066 | 0.026 | 0.028 | -0.024 | -0.07 |
| Gamma Notional (MM): | $4.8B | $8.7B | $30M | $4B | $132M | $3.3B |
| 25 Day Risk Reversal: | -5.46% | -4.92% | -5.65% | -4.82% | -5.64% | -5.05% |
| Call Volume: | 459K | 1.4M | 9K | 573K | 15K | 182K |
| Put Volume: | 1.1M | 2M | 7.3K | 790K | 22K | 583K |
| Call Open Interest: | 6.2M | 7.1M | 59K | 4.8M | 188K | 3.4M |
| Put Open Interest: | 12M | 15M | 71K | 8.6M | 350K | 7.5M |
| Key Support & Resistance Strikes |
|---|
| SPX Levels: [4200, 4150, 4100, 4000] |
| SPY Levels: [415, 414, 412, 410] |
| NDX Levels: [14000, 13200, 13100, 13000] |
| QQQ Levels: [320, 318, 315, 310] |
| SPX Combos: [(4350,91.57), (4325,82.40), (4321,89.61), (4300,98.24), (4275,93.40), (4250,96.44), (4242,77.14), (4225,93.91), (4221,78.53), (4213,86.97), (4209,88.92), (4204,84.40), (4200,99.32), (4196,76.08), (4192,93.42), (4184,91.37), (4179,86.72), (4175,99.10), (4171,89.78), (4167,80.71), (4163,86.64), (4159,92.08), (4150,98.07), (4063,79.20), (4051,82.02), (4013,86.60), (4001,94.98), (3951,89.43)] |
| SPY Combos: [418.77, 416.28, 413.8, 428.71] |
| NDX Combos: [13141, 13350, 13547, 12932] |
| QQQ Combos: [320.02, 324.81, 329.91, 309.82] |
0 comentarios