Macro Theme:
Major Resistance: $4,150 – $4,160 (SPY $415)
Pivot Level: $4,100
Critical Support: $4,000 Put Wall
Range High: $4,150 Call Wall
Range Low: $4,000 Put Wall
‣ We look for markets to consolidate after OPEX & heading into the 5/3 FOMC
‣ 1 Month IV is at lows near 16%, which is likely a long term low which reduces equity vanna tailwinds. It further implies that longer dated IV may be reasonably priced.
Founder’s Note:
Futures are off slightly to 4140. Key SG levels remain the same to last week, but the strength of those levels have been reduced. 4110 (SPY) – 4100 is first support with 4050 below. Above we mark 4150 – 4160 (SPY 415) as major overhead resistance.
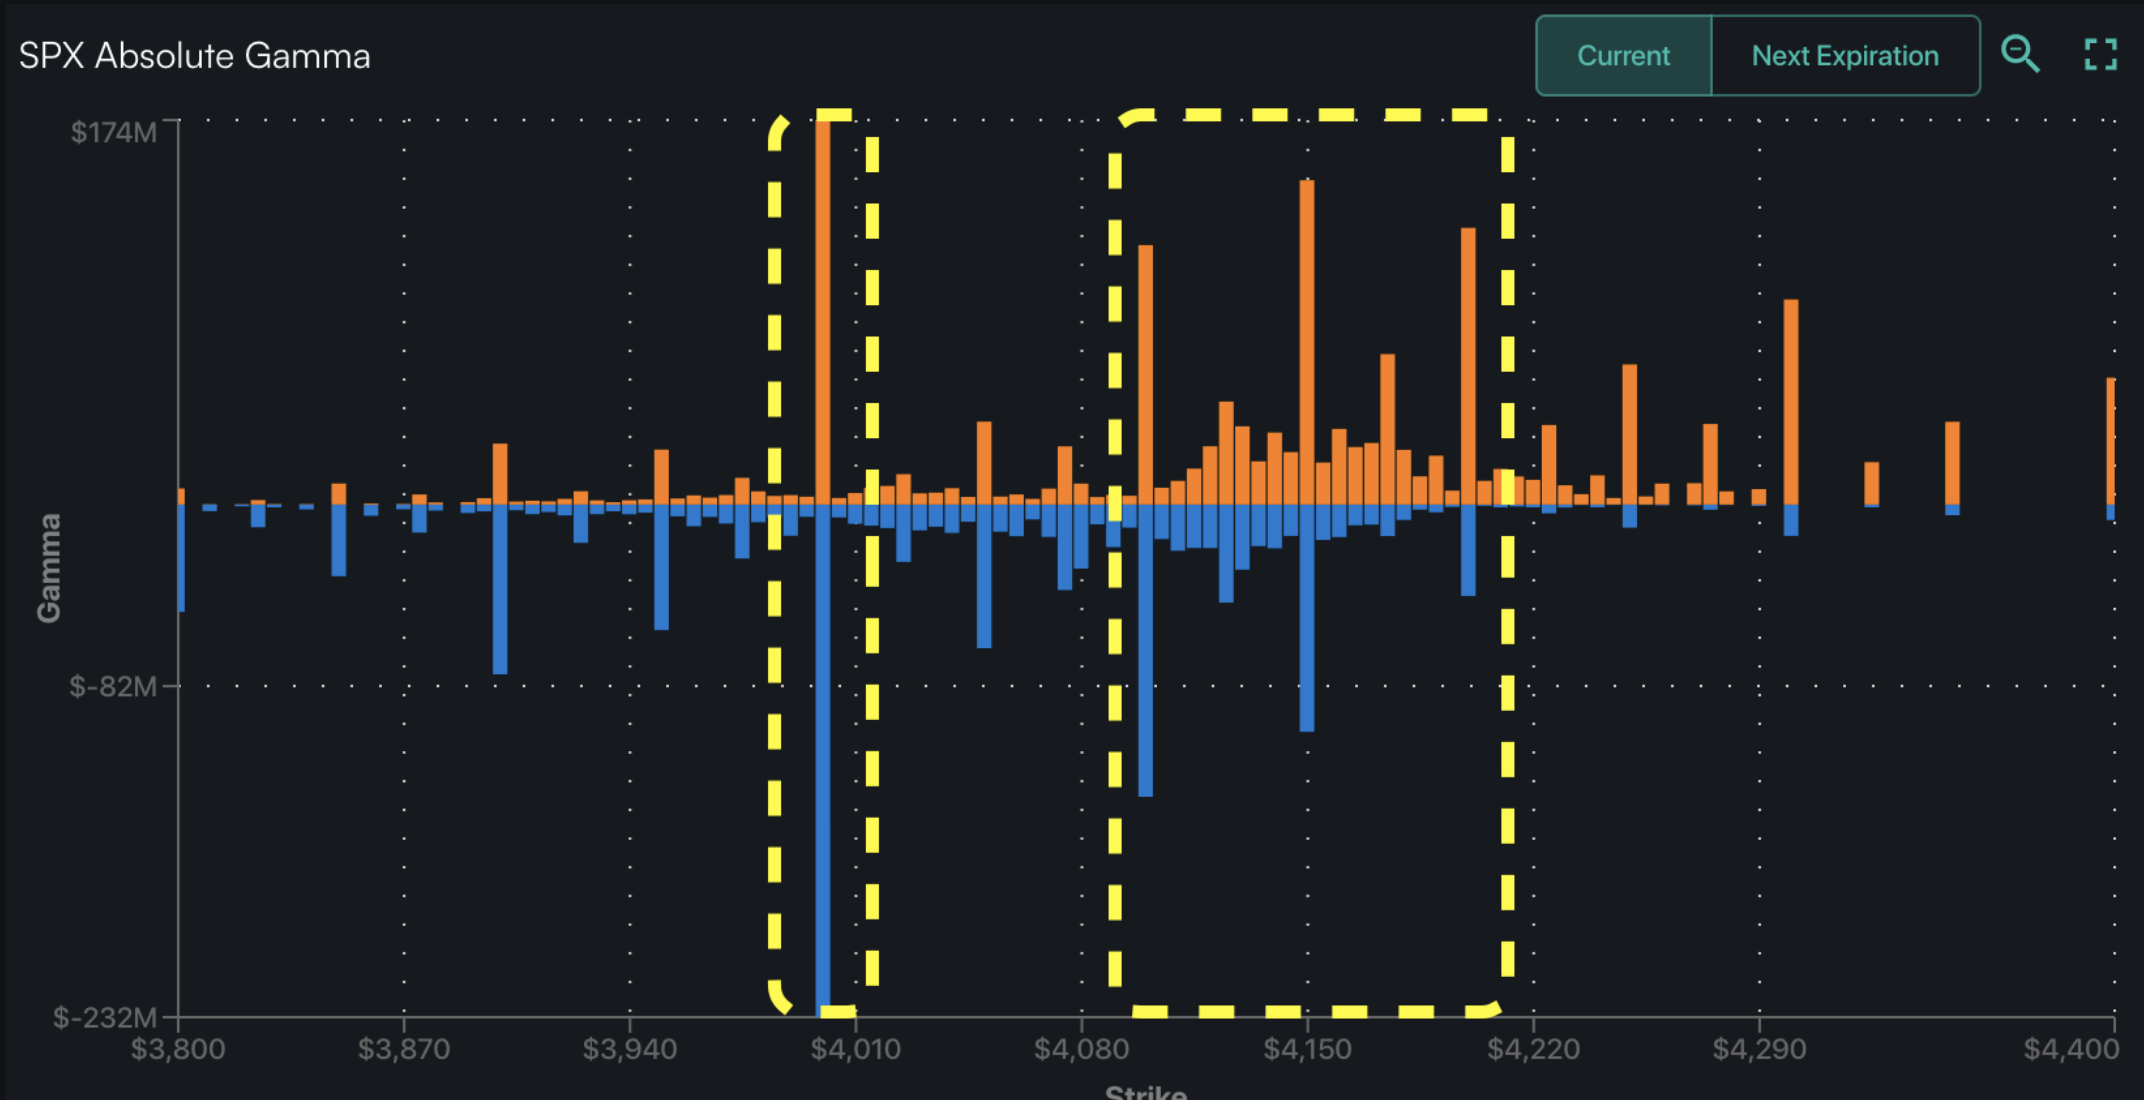
Macro focus for this week will be on earnings, and turning to the FOMC on 5/3. From the options side, we have been of the view that this post-OPEX week could face some market consolidation, and a bounce in implied volatility. As you can see in the plot of gamma by strike below, the key ATM/upside resistance range remains the 4100/4150/4200 area, then there is a large gap down to the large 4000 strike.
As noted above, the notional gamma of these levels was reduced by OPEX, which should reduce the positive gamma flow that held markets in the SPX 4100-4150/SPY 415-415 range last week. This reduction in positive gamma should allow for higher volatility/larger trading ranges. Higher volatility could lead to both higher or lower markets, but our call for market weakness is driven by the view that markets tend to weaken after large, call-heavy expirations.
An idea related to expiration stems from our Tilt readings. Shown below is Delta Tilt (blue) which measures the size of call delta vs put delta. There is a “wave function” to this, with pivots generally occurring around expirations. We think these Tilt highs & lows may speak to maximum exposures – levels at which inventories are full and that slows or halts market price trends. Tilt peaks are driven by exposures to calls, and troughts are maximum put exposures. Another curious development has been the lower ceiling of this metric after 2022. During the “easy money” period <2022 these Tilt readings were often up into the 4’s, vs peaks of 2 this past year. There seems to be less relative demand for Index calls.
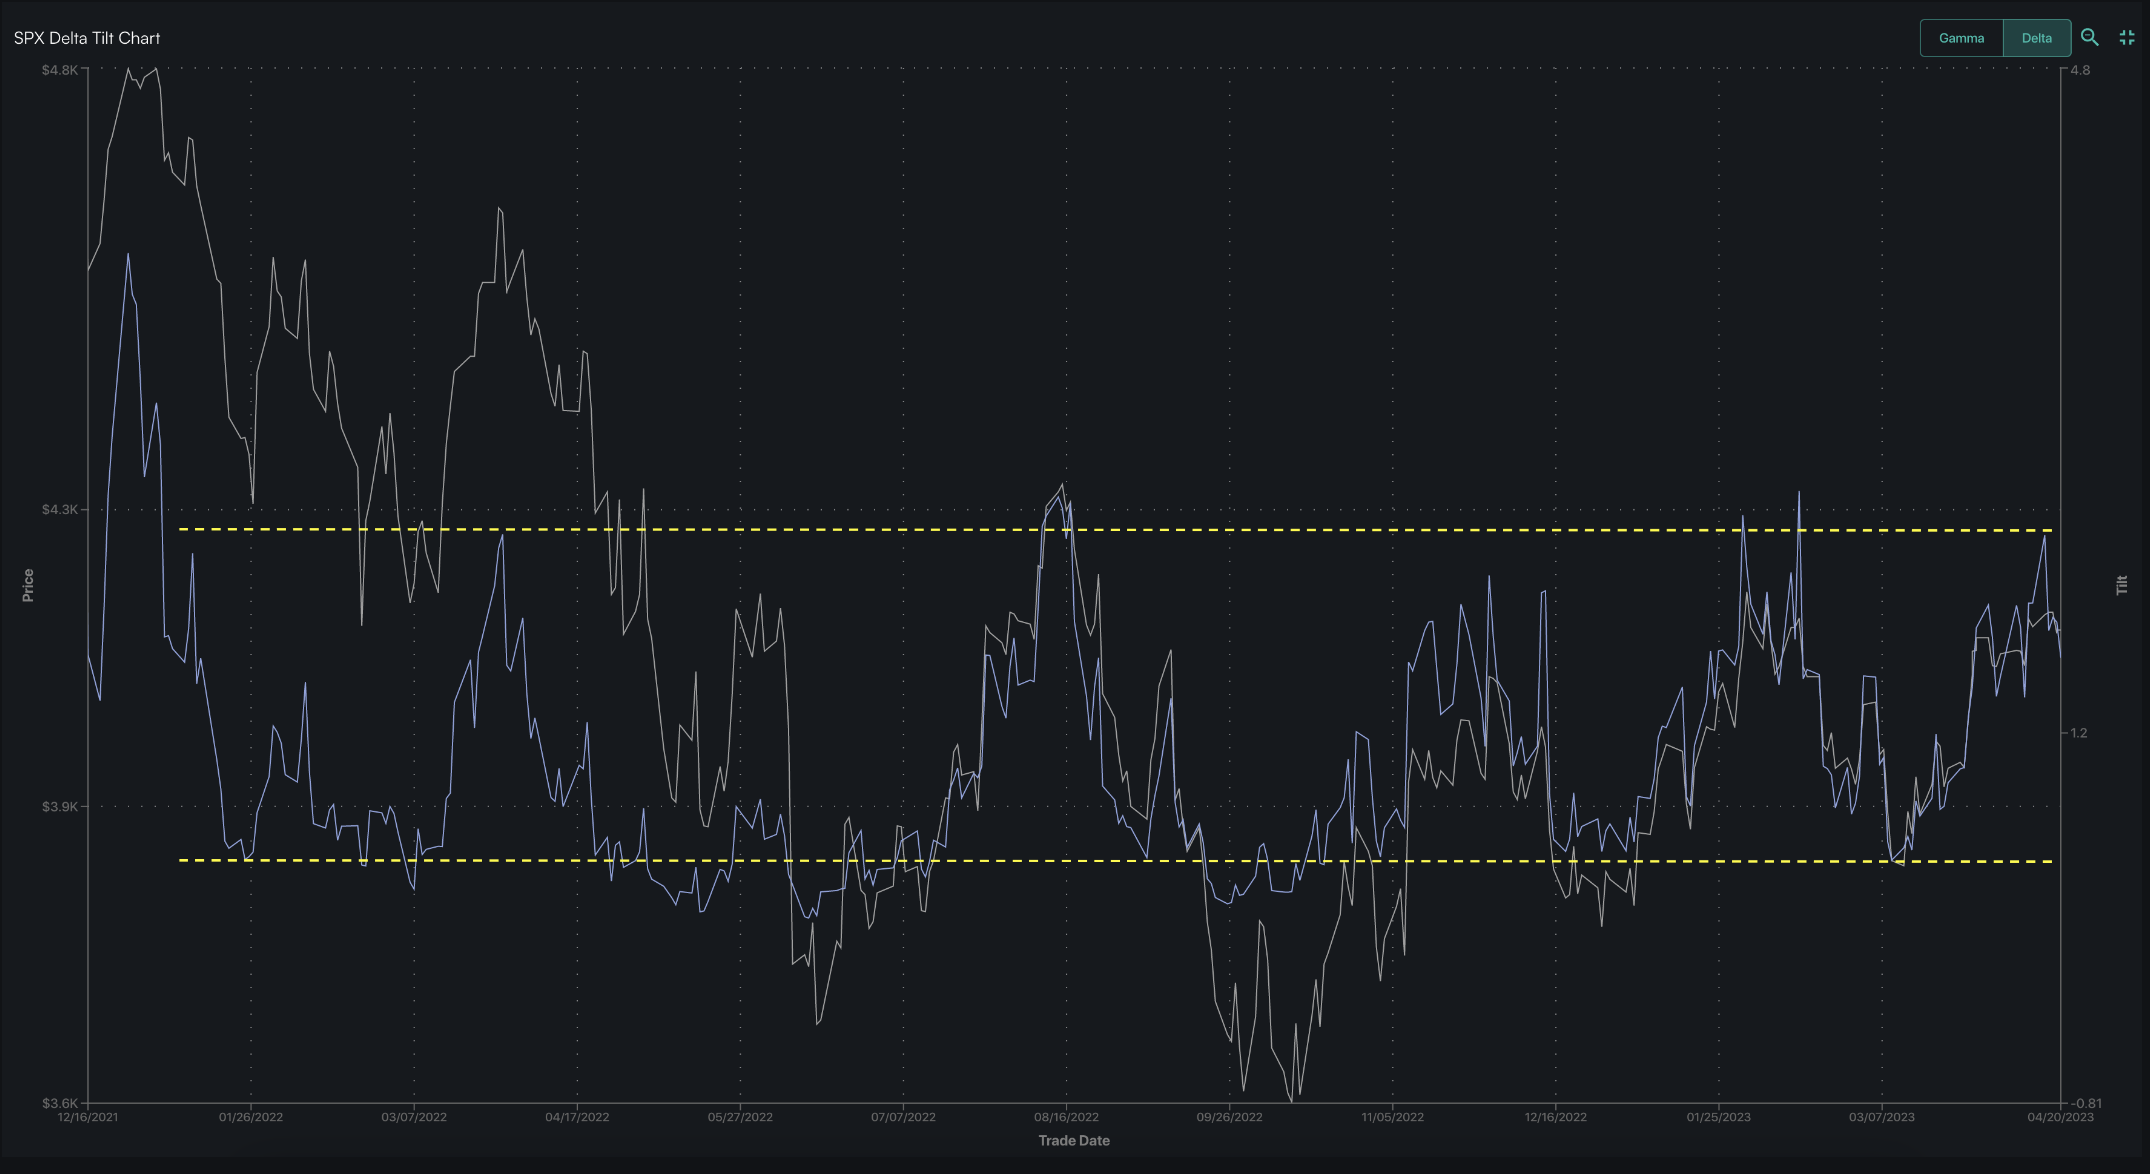
This Tilt metric has turned down with April’s expiration, which is driven by more net calls expiring vs puts. While these changes to positions may open the door for a larger correction, we read it more as a loss of momentum.
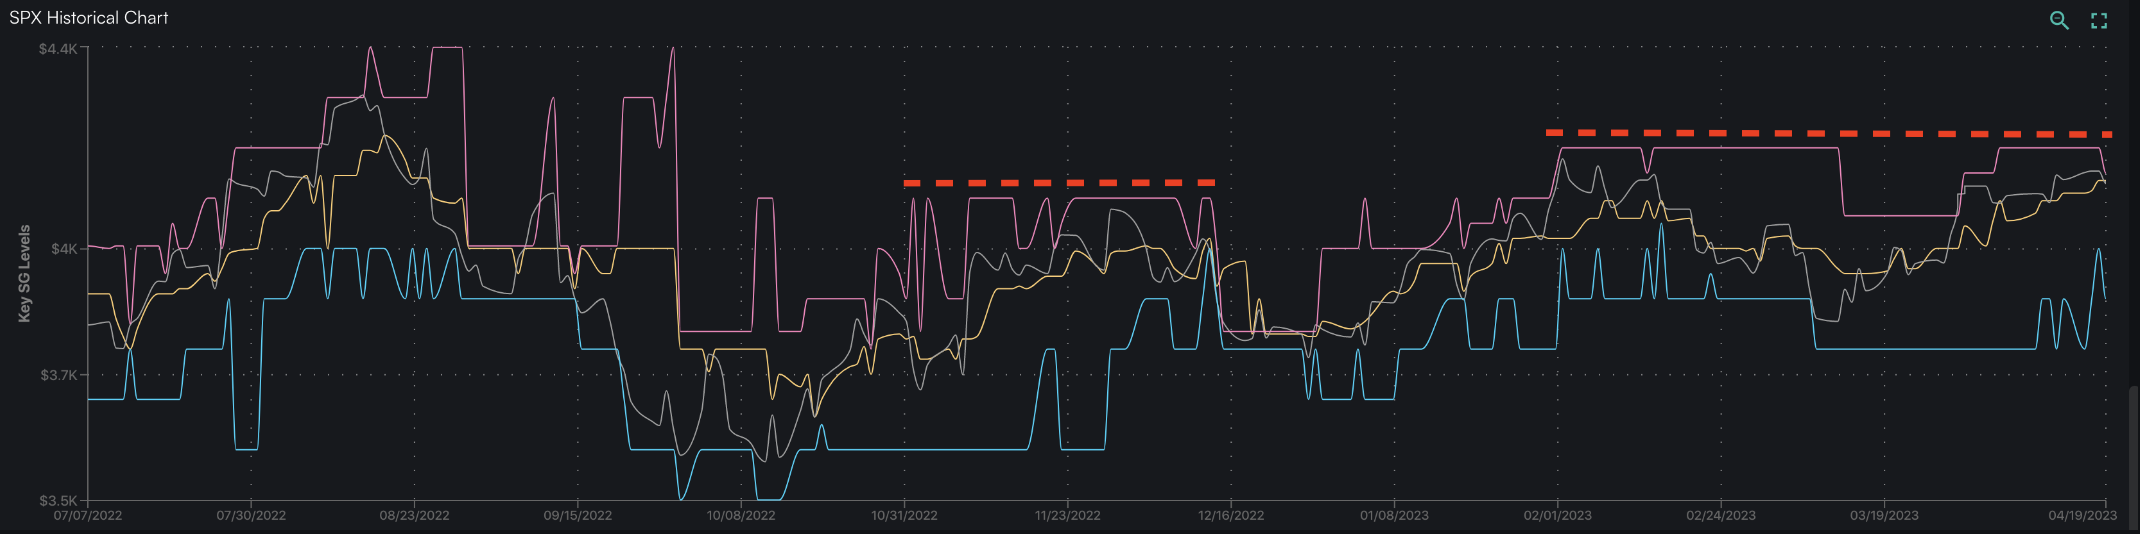
Over the past six months the 4100-4150 price range is where momentum has been consistently lost. Related to this, our Call Walls have consistently stalled in this 4100-4150 range, which we think says something about demand for S&P upside. This can be seen in the plot below, wherein the Call Walls (pink) stay unchanged despite the SPX (gray) testing the Call Wall (dashed red lines). Call Walls shift higher when calls are rolled up to higher strikes, and so we think it says something about demand when these levels are stationary despite higher SPX prices. Looking forward, should the Call Walls roll higher, then we think that unlocks upside SPX potential.
Further, off of these recent SPX highs we see IV touching +1 year lows, with a much smaller spread to realized. While low implied volatility doesn’t necessarily mean cheap implied volatility, it does suggest that vanna is less of a factor. Therefore, through our options lens, we have stalled out call positions and IV drained off. In more simple terms, the options market isn’t offering an equity tailwind at this juncture. This suggests that a catalyst has to come from the macro side, be it strong earnings or a market-friendly Fed on 5/3. Whatever it is it must be compelling enough to break the upper bound that has formed over the last 6 months.
| SpotGamma Proprietary Levels | SPX | SPY | NDX | QQQ | RUT | IWM |
|---|---|---|---|---|---|---|
| Reference Price: | $4133 | $412 | $13000 | $316 | $1791 | $177 |
| SpotGamma Implied 1-Day Move: | 0.85% | 0.85% |
|
|
|
|
| SpotGamma Implied 5-Day Move: | 2.32% |
|
|
|
|
|
| SpotGamma Volatility Trigger™: | $4115 | $411 | $12775 | $318 | $1760 | $177 |
| Absolute Gamma Strike: | $4000 | $412 | $12975 | $315 | $1800 | $175 |
| SpotGamma Call Wall: | $4200 | $415 | $12975 | $330 | $1780 | $180 |
| SpotGamma Put Wall: | $4000 | $400 | $11000 | $310 | $1600 | $170 |
| Additional Key Levels | SPX | SPY | NDX | QQQ | RUT | IWM |
|---|---|---|---|---|---|---|
| Zero Gamma Level: | $4109 | $411 | $12027 | $318 | $1956 | $183 |
| Gamma Tilt: | 1.1 | 0.89 | 1.7 | 0.83 | 0.66 | 0.6 |
| SpotGamma Gamma Index™: | 0.52 | -0.094 | 0.044 | -0.05 | -0.02 | -0.056 |
| Gamma Notional (MM): | $4.1B | $7.9B | $25M | $3.3B | $113M | $2.5B |
| 25 Day Risk Reversal: | -6.48% | -5.78% | -4.95% | -5.59% | -5.55% | -5.83% |
| Call Volume: | 480K | 1.7M | 19K | 559K | 23K | 218K |
| Put Volume: | 837K | 2.3M | 10K | 881K | 22K | 372K |
| Call Open Interest: | 5.7M | 6.3M | 50K | 4.2M | 163K | 2.9M |
| Put Open Interest: | 11M | 12M | 54K | 7.7M | 319K | 6.4M |
| Key Support & Resistance Strikes |
|---|
| SPX Levels: [4200, 4150, 4100, 4000] |
| SPY Levels: [415, 413, 412, 410] |
| NDX Levels: [14000, 13200, 13000, 12975] |
| QQQ Levels: [320, 315, 310, 300] |
| SPX Combos: [(4324,79.83), (4320,88.62), (4299,97.93), (4274,91.58), (4262,81.72), (4249,95.27), (4224,90.03), (4212,87.73), (4200,98.16), (4191,86.77), (4183,81.72), (4179,79.48), (4175,95.41), (4171,89.96), (4167,77.91), (4162,90.19), (4158,81.54), (4150,94.63), (4142,81.74), (4113,77.42), (4100,81.15), (4088,75.40), (4080,86.49), (4063,84.60), (4051,89.46), (4010,88.83), (4001,96.08), (3952,91.14)] |
| SPY Combos: [414.24, 419.19, 429.08, 416.71] |
| NDX Combos: [12975, 12728, 13547, 12936] |
| QQQ Combos: [320.4, 315.33, 316.92, 310.27] |
0 comentarios