Macro Theme:
Major Resistance: $4,200
Pivot Level: $4,150
Major Support: $4,100
Range High: $4,200 Call Wall
Range Low: $4,000 Put Wall
‣ We look for markets to consolidate into the 5/3 FOMC
‣ Bulls may have an edge into May OPEX, as low IV + positive gamma serve to support equities
Founder’s Note:
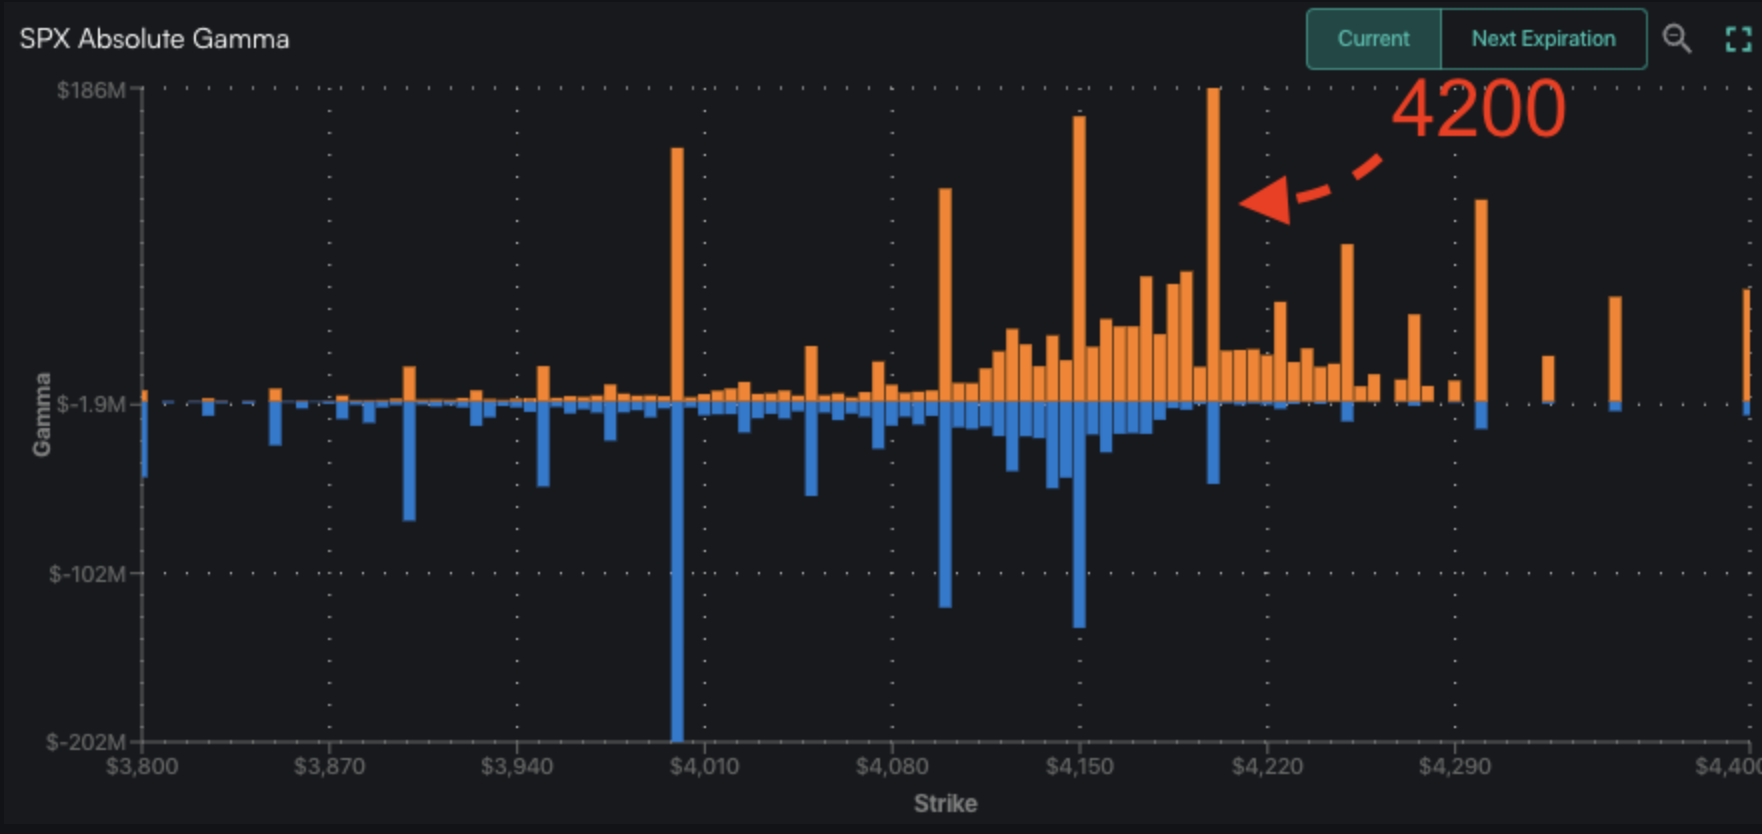
Futures are flat to Friday’s close, at 4180. This implies the SPX will open just above the large pivot/support line of 4160 (SPY 415) – 4150. The 4200 Call Wall shows as resistance above. Support below 4150 appears at 4110 (SPY 410) – 4100.
The big news over the weekend was the demise of FRC – the third regional bank to fold in recent weeks. We bring this up as futures are unchanged, and the VIX is elevated to 16.5 – but thats likely to to the weekend effect (VIX tends to close lower Friday, and higher Monday).
There was a solid build to call positions on Friday, which led to an increase in gamma at the 4200 Call Wall. As discussed in Fridays note, we think the close above 4150 invokes an S&P test of this large 4200 level. The 4200 Call Wall is also currently our max market high, and that remains until/unless the Call Wall rolls to a higher strike. As you can see below, both 4250 & 4300 are gaining in size (call gamma, orange), and with a neutral to bullish FOMC we may see the Wall roll higher to one of those strikes.
Due to 5/3 FOMC we anticipate today & tomorrow to be fairly neutral trading sessions. However, we continue to assign an edge to bulls into May OPEX. This is of course predicated on a benign FOMC outcome on 5/3, an event for which the market is assigning very low volatility.
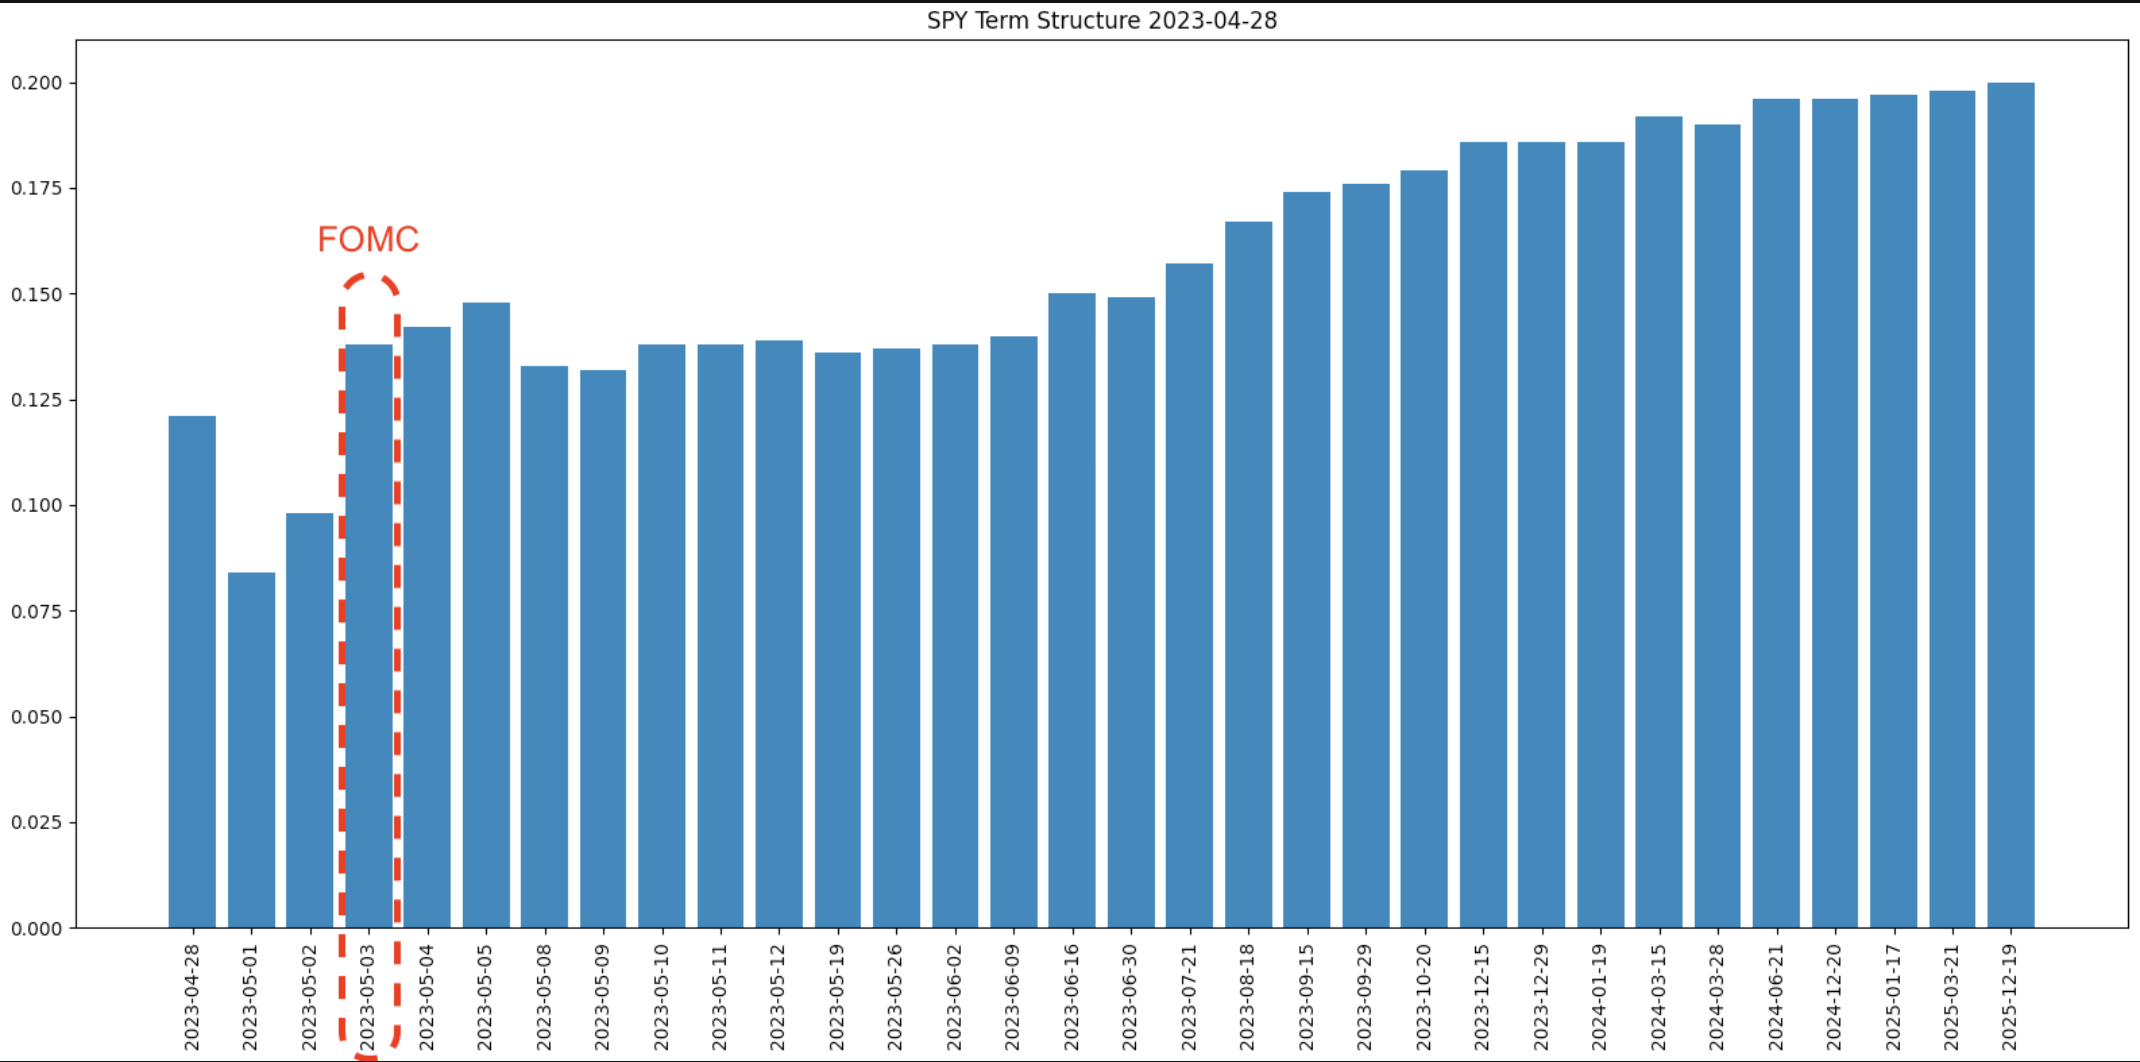
Shown below is the steep contango of SPY term structure, with a lowly 14% (!) IV assigned to 5/3 FOMC day. We have discussed this in the past, but it is rather remarkable how low IV is for not only FOMC, but all of the other major datapoints (ex: CPI, non farms) which used to draw elevated IV’s. From a sentiment perspective, this is a shift from “this datapoint/statement determines our destiny” to “just don’t give me a tail print”.
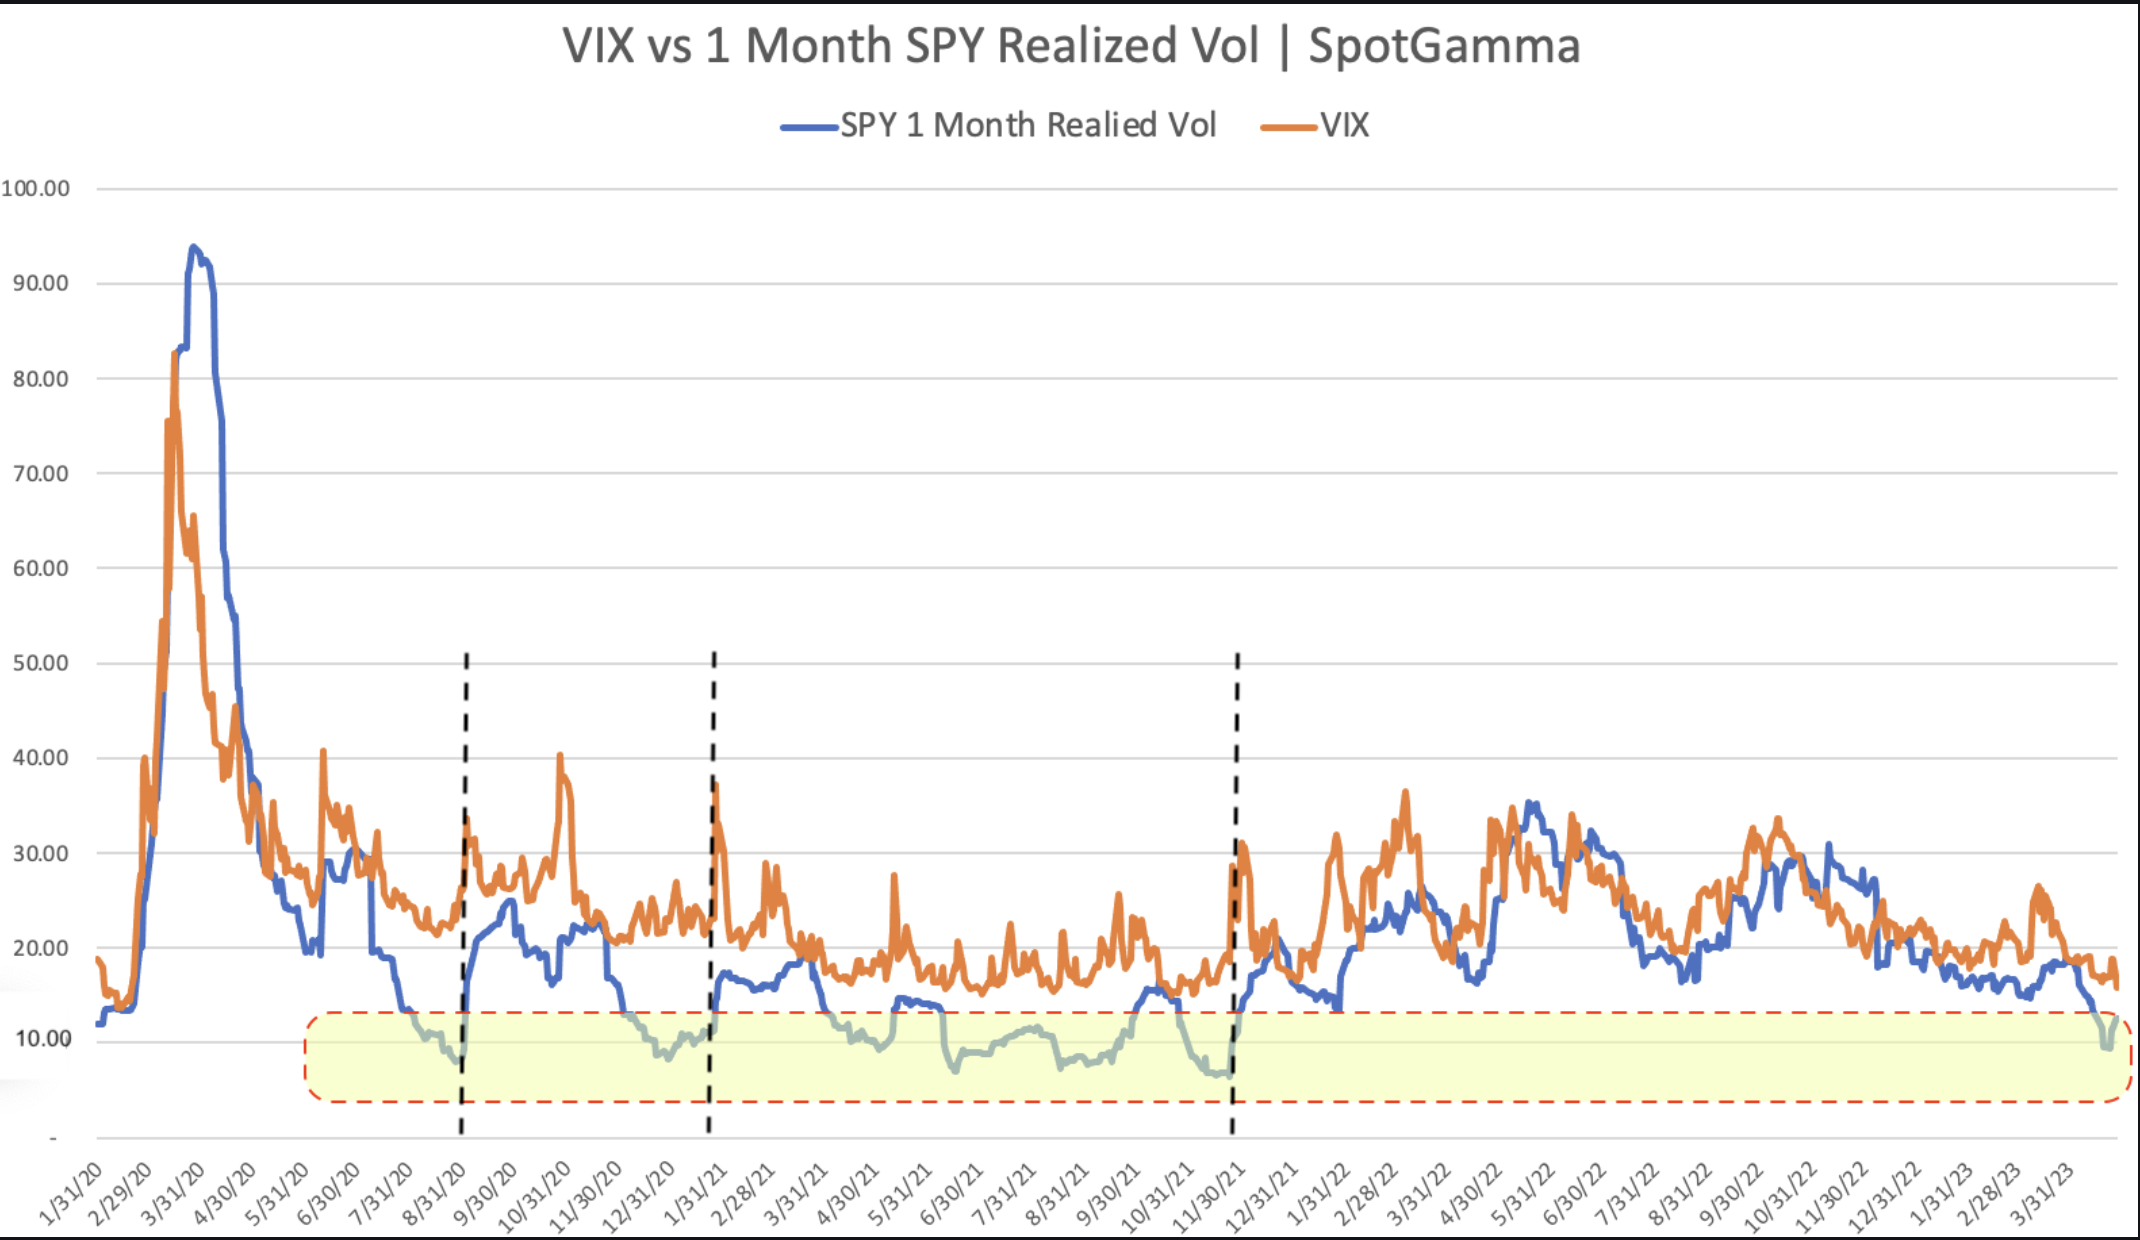
On this topic of IV, both RV and IV (i.e. VIX) are at +1 year lows. You can see RV as the blue line in the plot below, which is now at ~15%. What we find is that in when RV is <=16% (avg <=1% daily moves, shaded in yellow below), the S&P has an average forward 5 day return of +0.18% These are periods of market calm, which serve to drag IV lower. We believe this lower IV is a tailwind for equities through a few mechanisms, such as put decay/selling (which invites dealer short hedge covering), and CTA equity buying.
The tricky part here, is that these periods of calm tend to end violently (examples marked by black dotted lines).
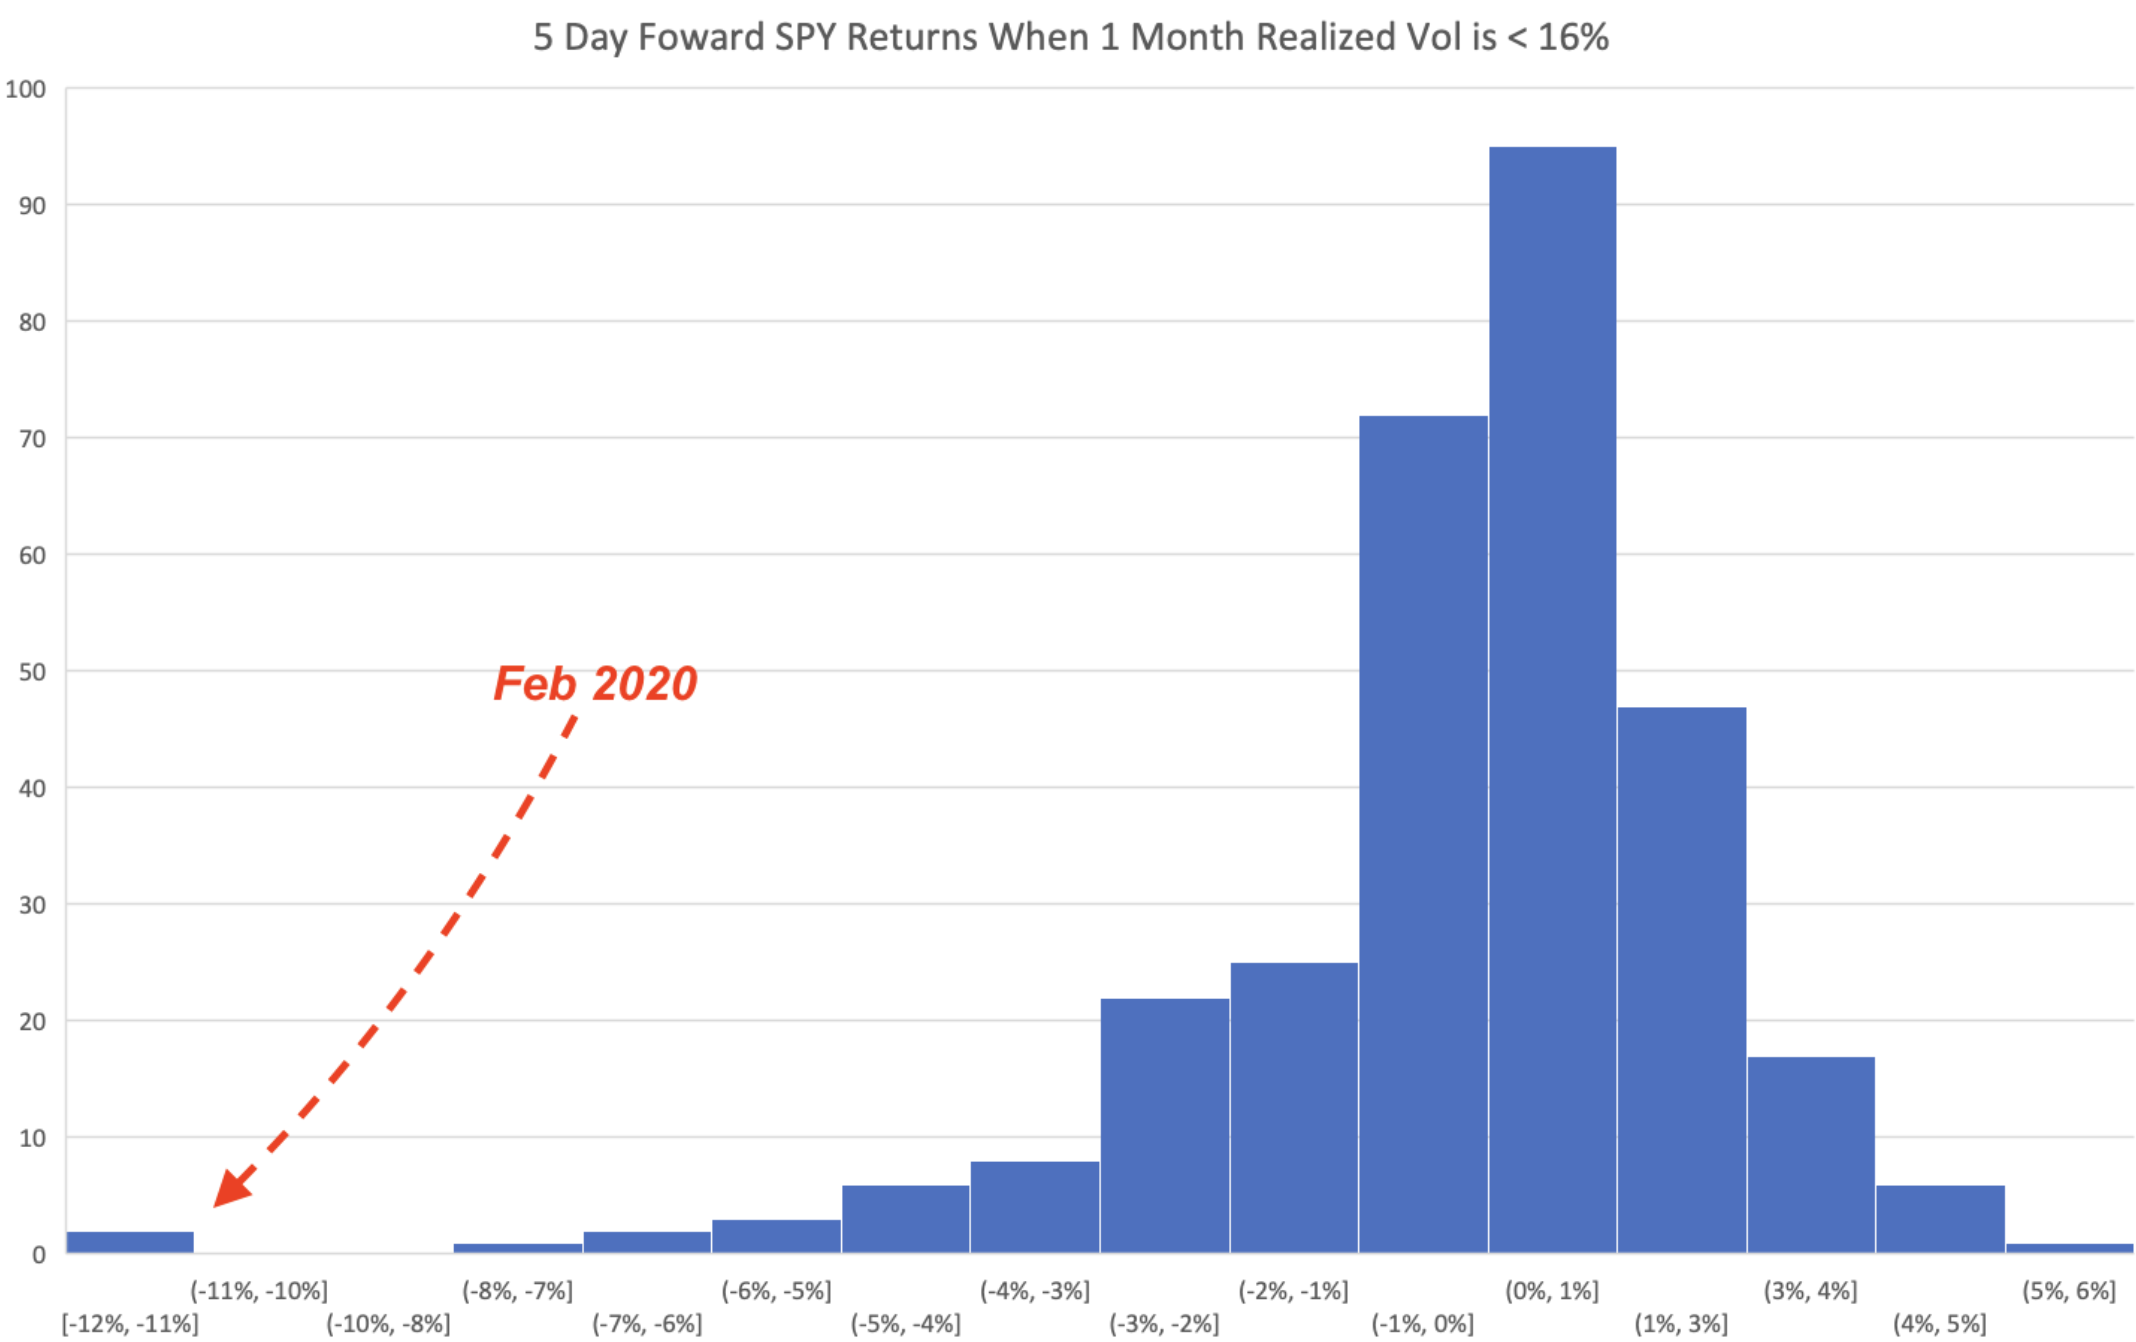
The histogram below plots the forward 5 day returns, and as you can see the returns tend to be positive, with some nasty left tails. Often times these periods of calm can be a bit head scratching, leaving traders to question the sanity of market bulls. This is something like a game of musical chairs, wherein you want to be long equities only until the music stops/IV pops. A prime example of this was in Feb ’20 when the news was dominated by the surge in Covid, but equities were calmly rising to all time highs. Then, suddenly (right on Feb OPEX), markets turned violently lower.
We’ve talked a lot recently about how markets see possible risks as “tomorrow’s problem”, and so 0DTE continues to flow and any relative jumps in IV are being sold. Fortunately the low IV makes owning longer dated puts vs long equities a bit more palatable. Additionally, our base case is that the current positive gamma environment continues to build into May OPEX, which helps to reduce IV aiding to pull stocks higher. The other signal of major “risk off” would be a break of 4100, as it signals that positive gamma has been eroded, which implies larger market drawdowns.
| SpotGamma Proprietary Levels | SPX | SPY | NDX | QQQ | RUT | IWM |
|---|---|---|---|---|---|---|
| Reference Price: | $4169 | $415 | $13245 | $322 | $1768 | $175 |
| SpotGamma Implied 1-Day Move: | 0.89% | 0.89% |
|
|
|
|
| SpotGamma Implied 5-Day Move: | 2.54% |
|
|
|
|
|
| SpotGamma Volatility Trigger™: | $4145 | $411 | $12775 | $319 | $1770 | $176 |
| Absolute Gamma Strike: | $4000 | $415 | $12975 | $320 | $1800 | $175 |
| SpotGamma Call Wall: | $4200 | $420 | $12975 | $330 | $1780 | $177 |
| SpotGamma Put Wall: | $4000 | $400 | $11000 | $300 | $1800 | $170 |
| Additional Key Levels | SPX | SPY | NDX | QQQ | RUT | IWM |
|---|---|---|---|---|---|---|
| Zero Gamma Level: | $4114 | $415 | $12162 | $322 | $1874 | $186 |
| Gamma Tilt: | 1.5 | 1 | 1.8 | 1 | 0.63 | 0.50 |
| SpotGamma Gamma Index™: | 1.9 | 0.04 | 0.05 | 0.01 | -0.03 | -0.08 |
| Gamma Notional (MM): | $4.6B | $8.3B | $26M | $3.6B | $130M | $2.9B |
| 25 Day Risk Reversal: | -0.06 | -0.05 | -0.05 | -0.05 | -0.04 | -0.05 |
| Call Volume: | 653K | 1.9M | 9.5K | 707K | 36K | 207K |
| Put Volume: | 1.1M | 2.9M | 8K | 1.2M | 43K | 609K |
| Call Open Interest: | 6M | 6.9M | 53K | 4.5M | 177K | 3M |
| Put Open Interest: | 11M | 13M | 58K | 8.3M | 316K | 6.7M |
| Key Support & Resistance Strikes |
|---|
| SPX Levels: [4200, 4150, 4100, 4000] |
| SPY Levels: [420, 415, 412, 410] |
| NDX Levels: [14000, 13500, 13000, 12975] |
| QQQ Levels: [325, 322, 320, 315] |
| SPX Combos: [(4349,95.95), (4324,86.75), (4320,90.73), (4311,81.73), (4299,99.07), (4290,77.65), (4274,94.64), (4270,76.47), (4261,89.93), (4249,98.29), (4245,84.00), (4240,84.69), (4236,89.64), (4232,89.76), (4224,95.58), (4220,89.90), (4215,89.08), (4211,95.89), (4207,88.68), (4199,99.66), (4194,80.64), (4190,98.85), (4186,96.87), (4182,93.18), (4174,95.60), (4169,88.97), (4165,86.42), (4161,88.52), (4149,90.88), (4144,83.12), (4111,75.85), (4090,79.23), (4061,83.20), (4049,86.90), (4011,87.19), (3999,95.28)] |
| SPY Combos: [422.58, 432.57, 418.43, 402.2] |
| NDX Combos: [12981, 13352, 13551, 13763] |
| QQQ Combos: [317.38, 331.55, 319.64, 316.42] |
0 comentarios