Macro Theme:
Major Resistance: $4,225 (SPY $422 Call Wall)
Pivot Level: $4,200 (SPY $420)
Interim Support: $4,150
Major Support: $4,100
Range High: $4,300 Call Wall
Range Low: $4,000 Put Wall
‣ A break of 4100 is “risk off”, likely invoking a test of $4,000
‣ Equities may enter a “window of weakness” after 5/17 VIX & 5/19 OPEX
Founder’s Note:
Futures are flat, holding 4,200. The 4,200 SPX & SPY 420 level picked up some interest yesterday (20k SPX, 50k SPY), adding to its importance as a pivot level. We see resistance above at the 422 SPY Call Wall (SPX 4,225), with first support at the 4,170 Vol Trigger. More material support rests at 4,150. We continue to look for consolidation this week due to post-OPEX dynamics as was outlined several weeks ago.
The S&P held closely yesterday to that 4,200 pivot level, and there was little follow through to the “AI mania” of last week.
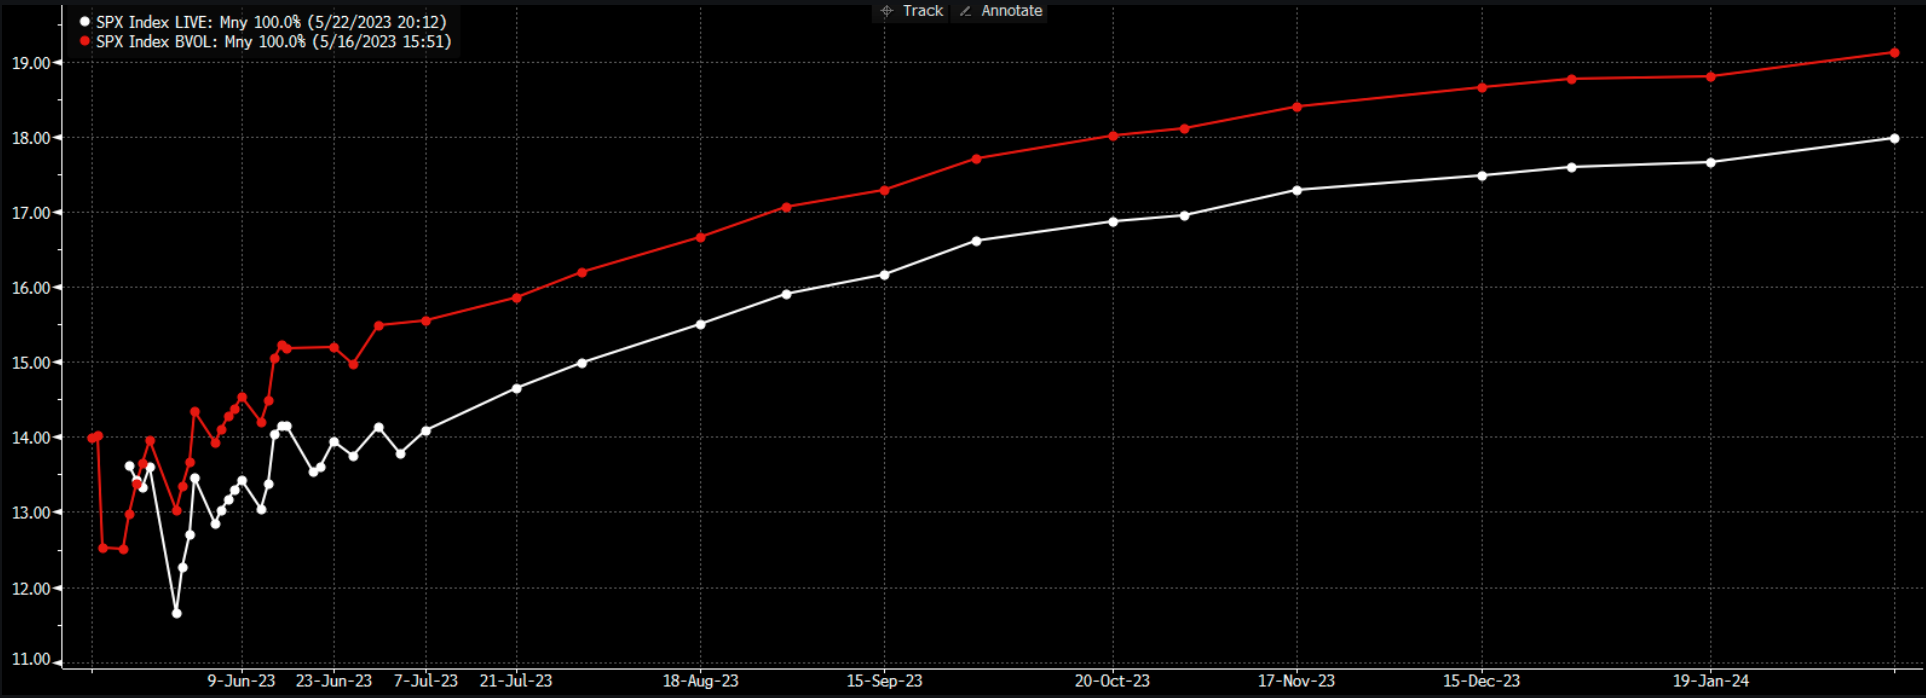
Implied volatility is pricing in little to no risk as 1 ATM month IV (14%) trades at 1 month RV (13%) – that spread suggests options are “priced for perfection”. The issue with this is that a tremor of risk can shake out short volatility players which can lead to jumpy equity moves lower. Further, it implies that vanna as a market tailwind has drained off.
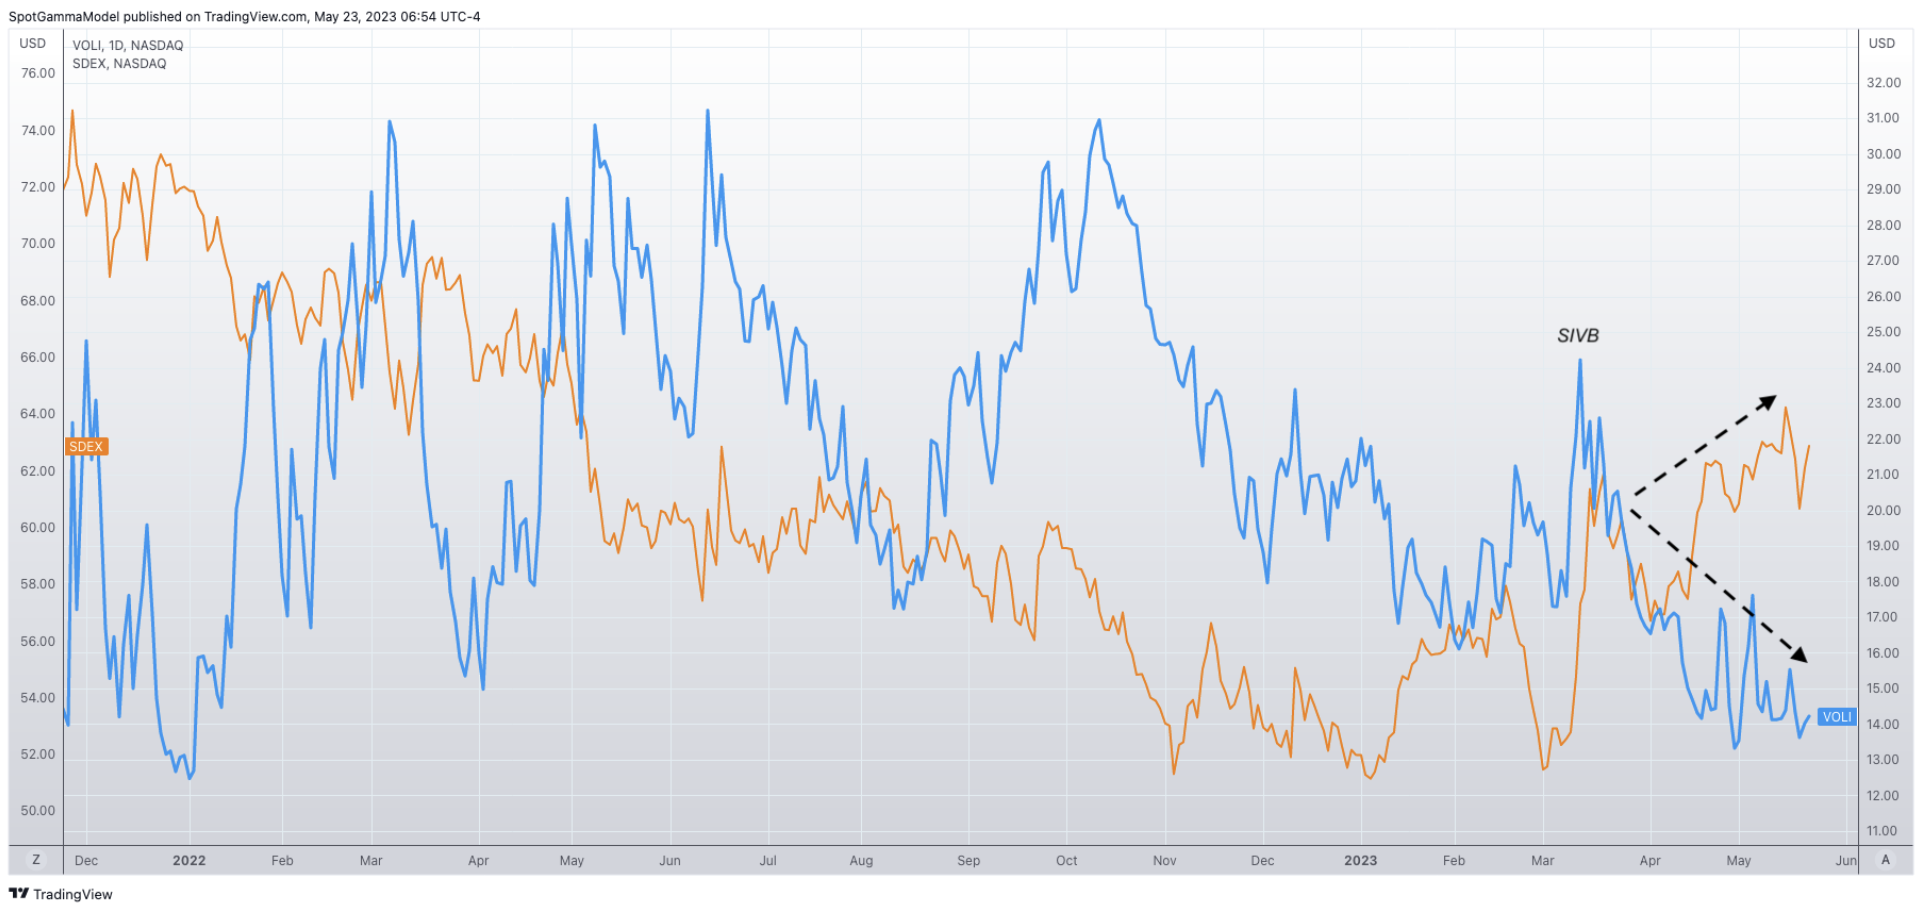
While ATM IV deflates, the put skew which has been more or less prevalent since the March bank crisis, remains. This is most simply visualized with VOLI (1 month ATM SPY IV) vs SDEX (SPY skew index). As you can see, SDEX (orange) is elevated as a result of this demand for tail risk – demand which had significantly waned into ’22 year end. SIVB’s failure in March re-bid that tail demand, and this elevated skew has remained. The more ATM IV’s have been crushed, as reflected by VOLI (blue). The bullish argument to this is that traders are hedged, but we would posit that they’re hedged for a “fast 10% crash”, not necessarily a 5% sucker punch.
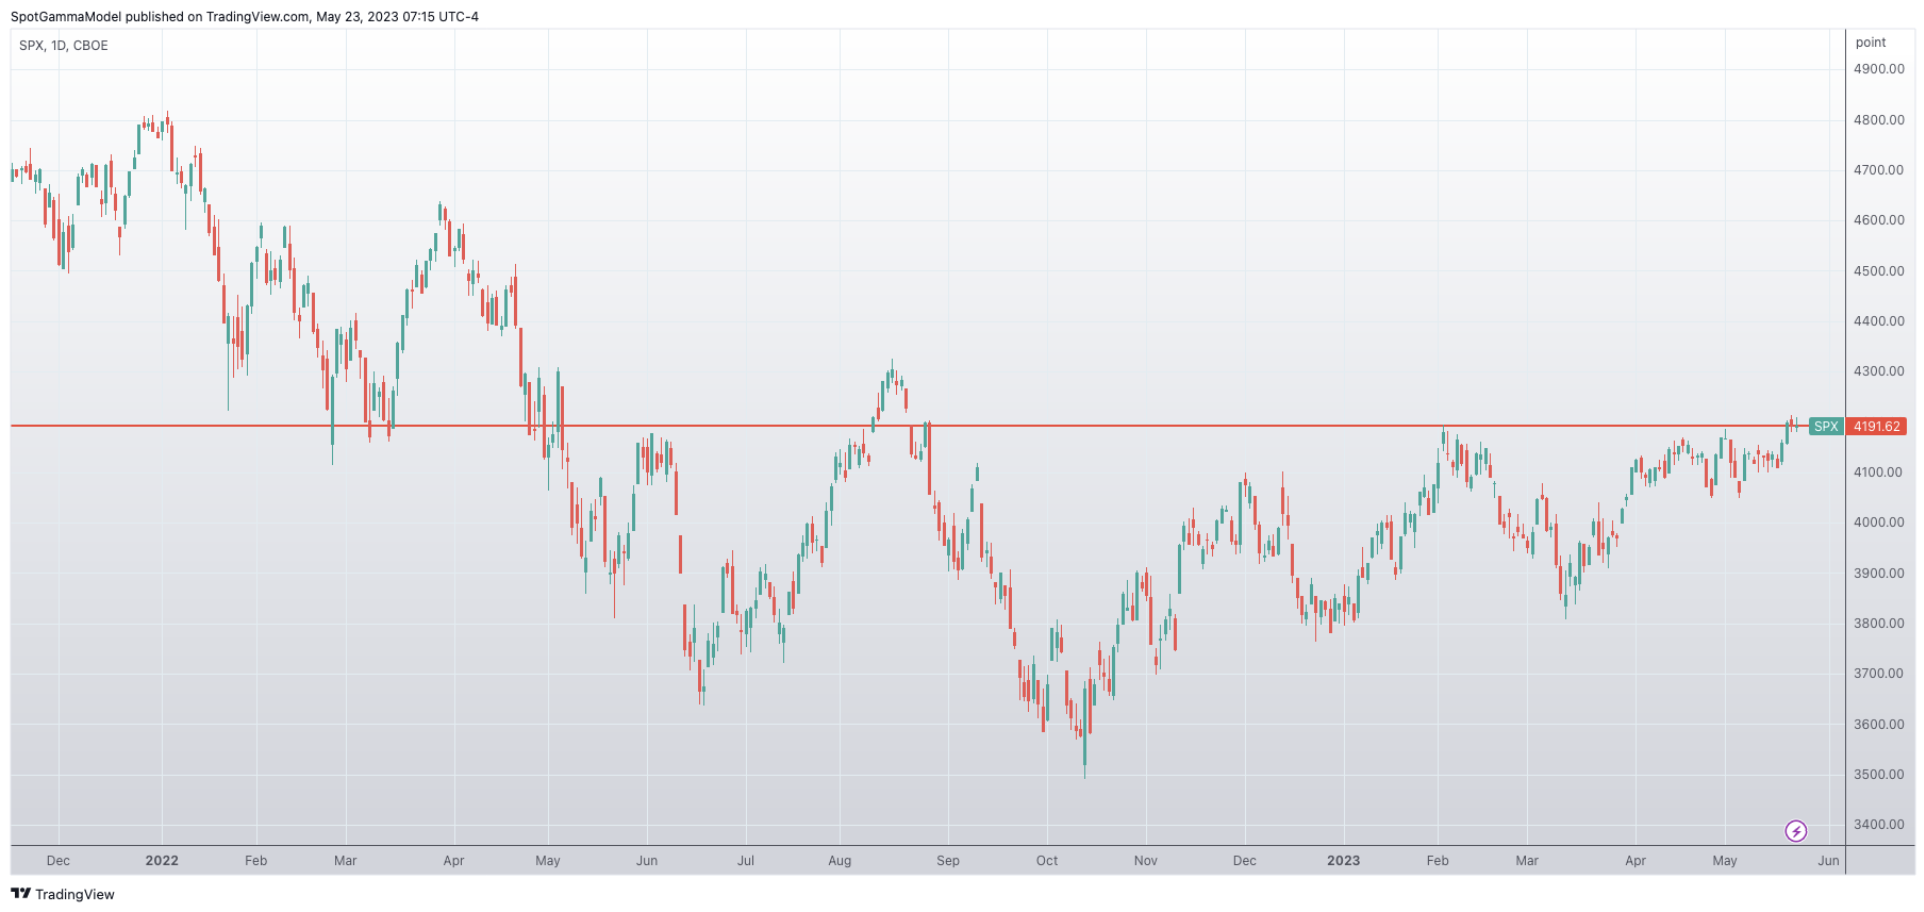
With these ~1 year lows in RV/IV we also have the S&P at a major 4200 resistance line. This is a level which the market has rejected on the last several rally attempts. It could be different this time as traders ride the AI narrative, and our key index/ETF Call Wall levels now show additional room to the upside. A close above 4200 is our signal that “risk on” resumes.
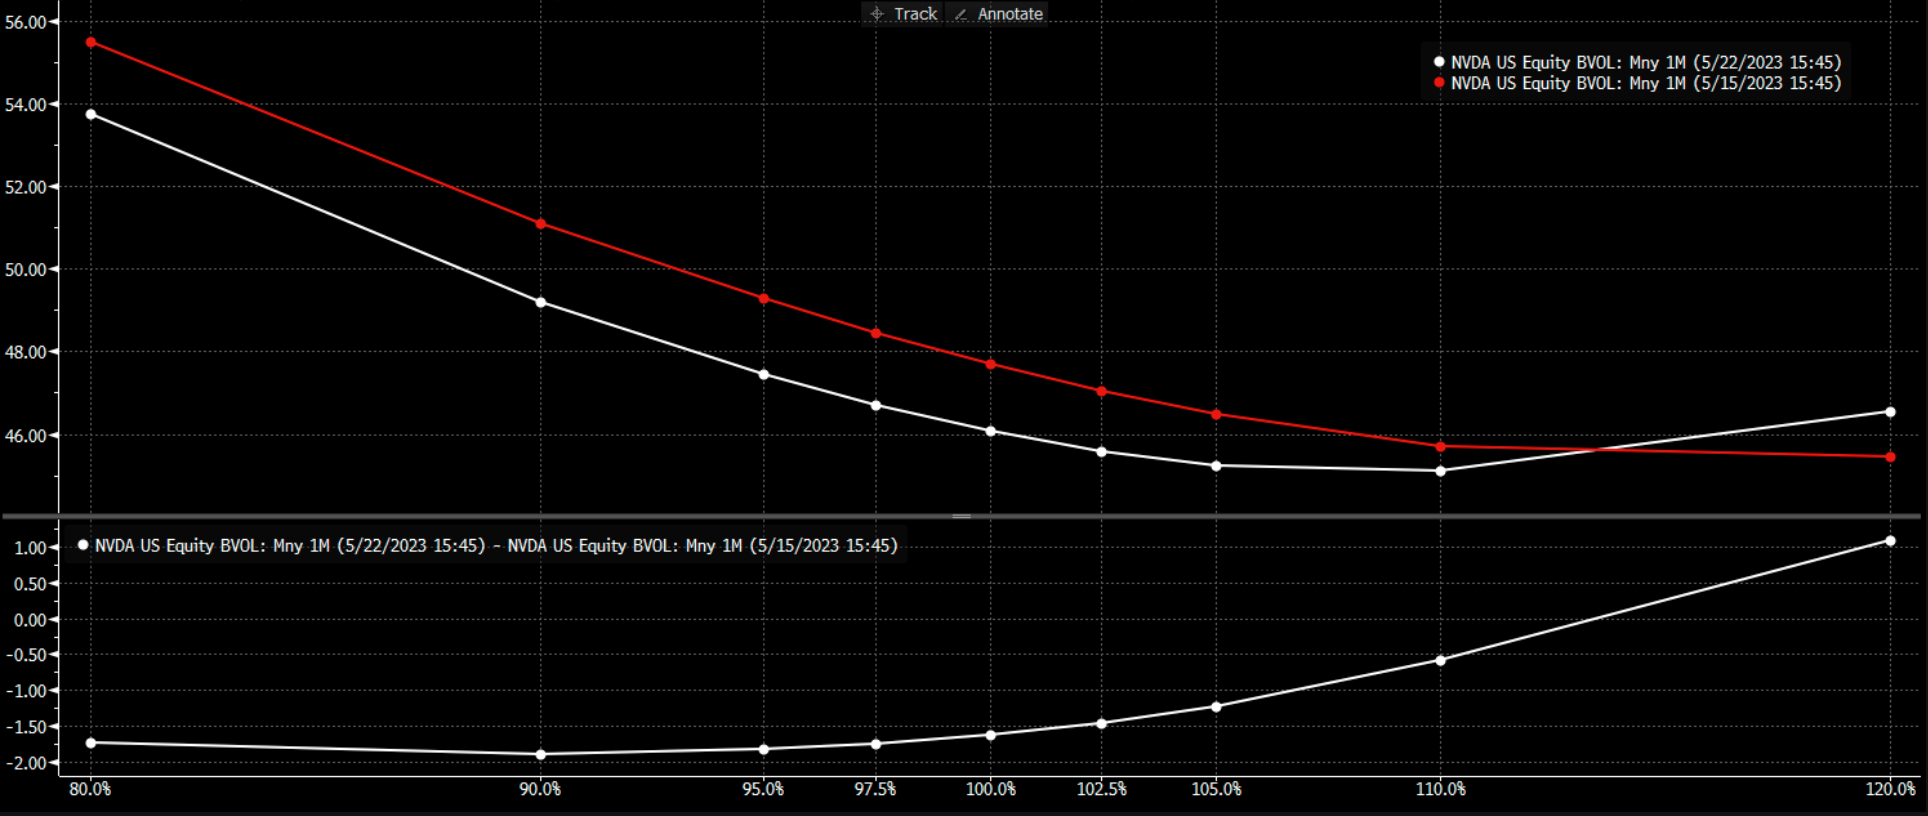
If you are looking for ways to play upside, the Indicies may offer a bit better relative value now that the OPEX pin has been pulled. Our preferred method of playing upside has been megacap tech and buying the “breakout” names. Through an options lens, these names are a bit crowded, suggesting that calls are expensive. Below is skew for NVDA, for example, and and you can see those IV’s are elevated for upside strikes (white). This is the type of pattern that appears when things get chase-y, and suggests that traders may have an incentive to spread off long calls or adjust in other ways to account for that call skew. This may turn the gamma/vanna upside lift to more of a damper, which could stall rally momentum in these names.
| SpotGamma Proprietary Levels | SPX | SPY | NDX | QQQ | RUT | IWM |
|---|---|---|---|---|---|---|
| Reference Price: | $4192 | $418 | $13850 | $337 | $1795 | $178 |
| SpotGamma Implied 1-Day Move: | 0.89% | 0.89% |
|
|
|
|
| SpotGamma Implied 5-Day Move: | 2.20% |
|
|
|
|
|
| SpotGamma Volatility Trigger™: | $4170 | $418 | $13175 | $338 | $1750 | $176 |
| Absolute Gamma Strike: | $4150 | $420 | $13850 | $335 | $1800 | $175 |
| SpotGamma Call Wall: | $4300 | $422 | $13850 | $340 | $1790 | $180 |
| SpotGamma Put Wall: | $4000 | $400 | $11000 | $327 | $1700 | $170 |
| Additional Key Levels | SPX | SPY | NDX | QQQ | RUT | IWM |
|---|---|---|---|---|---|---|
| Zero Gamma Level: | $4137 | $421 | $12622 | $337 | $1888 | $183 |
| Gamma Tilt: | 1.306 | 0.835 | 2.281 | 1.034 | 0.750 | 0.707 |
| SpotGamma Gamma Index™: | 1.351 | -0.163 | 0.073 | 0.010 | -0.018 | -0.046 |
| Gamma Notional (MM): | $435.926M | ‑$724.035M | $10.394M | ‑$23.391M | ‑$19.352M | ‑$490.678M |
| 25 Day Risk Reversal: | -0.063 | -0.064 | -0.044 | -0.05 | -0.051 | -0.058 |
| Call Volume: | 471.444K | 1.566M | 9.039K | 533.288K | 14.689K | 290.30K |
| Put Volume: | 902.793K | 2.324M | 8.593K | 971.444K | 27.164K | 638.043K |
| Call Open Interest: | 6.171M | 6.631M | 63.278K | 4.398M | 194.193K | 3.324M |
| Put Open Interest: | 11.733M | 13.528M | 57.849K | 8.809M | 339.473K | 7.281M |
| Key Support & Resistance Strikes |
|---|
| SPX Levels: [4200, 4150, 4100, 4000] |
| SPY Levels: [420, 419, 418, 415] |
| NDX Levels: [14500, 14000, 13850, 13000] |
| QQQ Levels: [340, 338, 335, 330] |
| SPX Combos: [(4398,97.94), (4352,94.96), (4327,90.71), (4318,93.55), (4306,78.58), (4302,99.24), (4281,83.55), (4276,96.15), (4268,78.48), (4264,78.85), (4260,87.69), (4256,89.20), (4251,99.05), (4243,86.42), (4239,88.43), (4235,89.68), (4230,87.12), (4226,98.47), (4222,94.69), (4214,91.50), (4209,94.04), (4205,90.97), (4201,98.76), (4188,85.13), (4163,74.74), (4155,79.99), (4126,88.93), (4105,74.73), (4100,82.84), (4050,89.81), (4025,75.57), (4004,85.19), (4000,95.97)] |
| SPY Combos: [429.67, 424.64, 419.62, 422.13] |
| NDX Combos: [13850, 13947, 14363, 14155] |
| QQQ Combos: [338.47, 340.83, 328.01, 350.95] |
0 comentarios