Macro Theme:
Major Resistance: $4,200 (SPY $420 Call Wall)
Pivot Level: $4,150 (SPY $415)
Interim Support: $4,100
Range High: $4,300 Call Wall
Range Low: $4,000 Put Wall
‣ A break of 4100 is “risk off”, likely invoking a test of $4,000
‣ $4,000 is considered material, long term support
Founder’s Note:
Futures are up fractionally to 4,160. Near term SG levels are unchanged, with 4,150 – 4,160 (SPY 415) the pivot area. Support shows at SPY 412 (SPX 4,130), then 4110 – 4,100. Resistance above lies at the 4200 Call Wall. Its of note the SPX Call Wall has retracted to 4,200 (from 4,300) which we generally consider bearish. That is counteracted by the QQQ Call Wall, remarkably, has rolled higher to 350 (from 340).
Sentiment around the debt ceiling seems to be positive as we head into a holiday weekend. Positive sentiment & an extra day of holiday options decay should be generally supportive of equity markets for today.
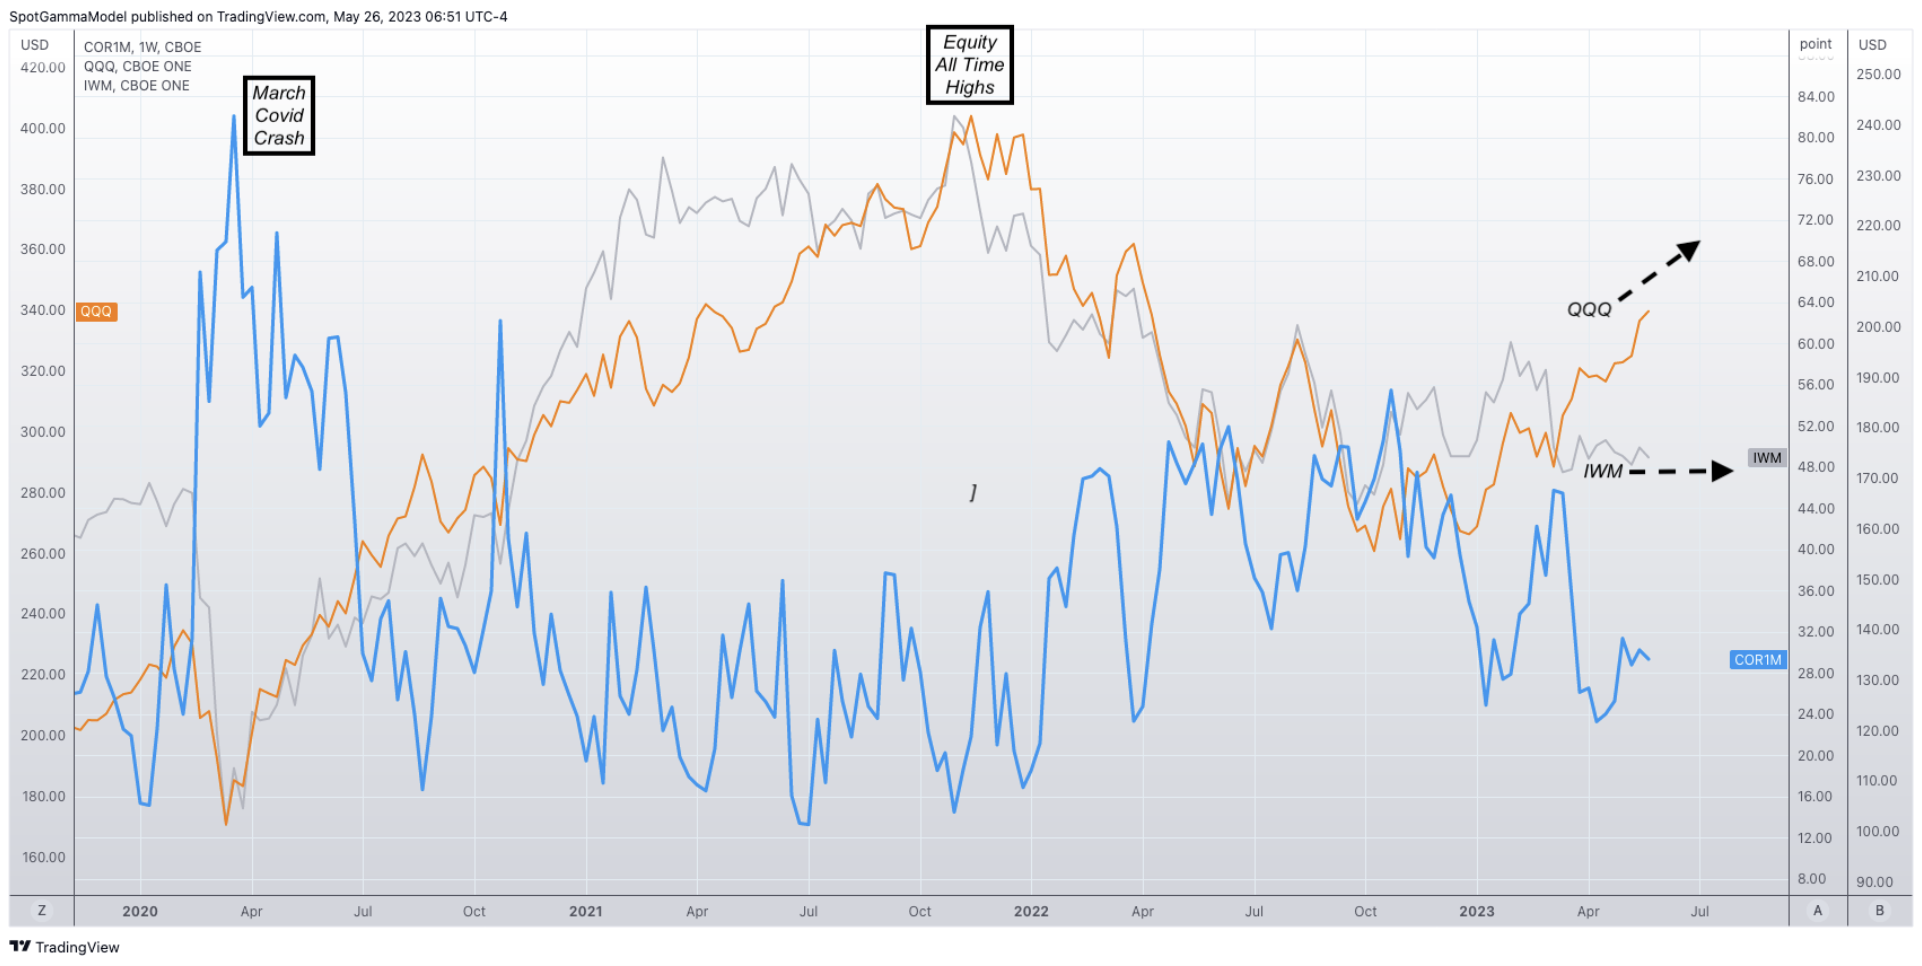
Yesterday we touched on the topic of correlation, and how it is falling. Below we’ve plotted the CBOE COR1M, which is specifically the difference between the implied volatility of at-the-money SPX index options and the average implied volatility of at-the-money options on SPX component stocks.
Generally when markets crash and there is a wholesale “risk off” all stocks fall in unison, which leads to higher correlation. However in rallies correlation generally declines, as is happening now. Its quite apparent in this environment as select technology stocks launch higher, while nearly all other sectors are flat to lower. This was particularly on display yesterday with QQQ +2.4%, SPY +0.87%, IWM -0.78%.
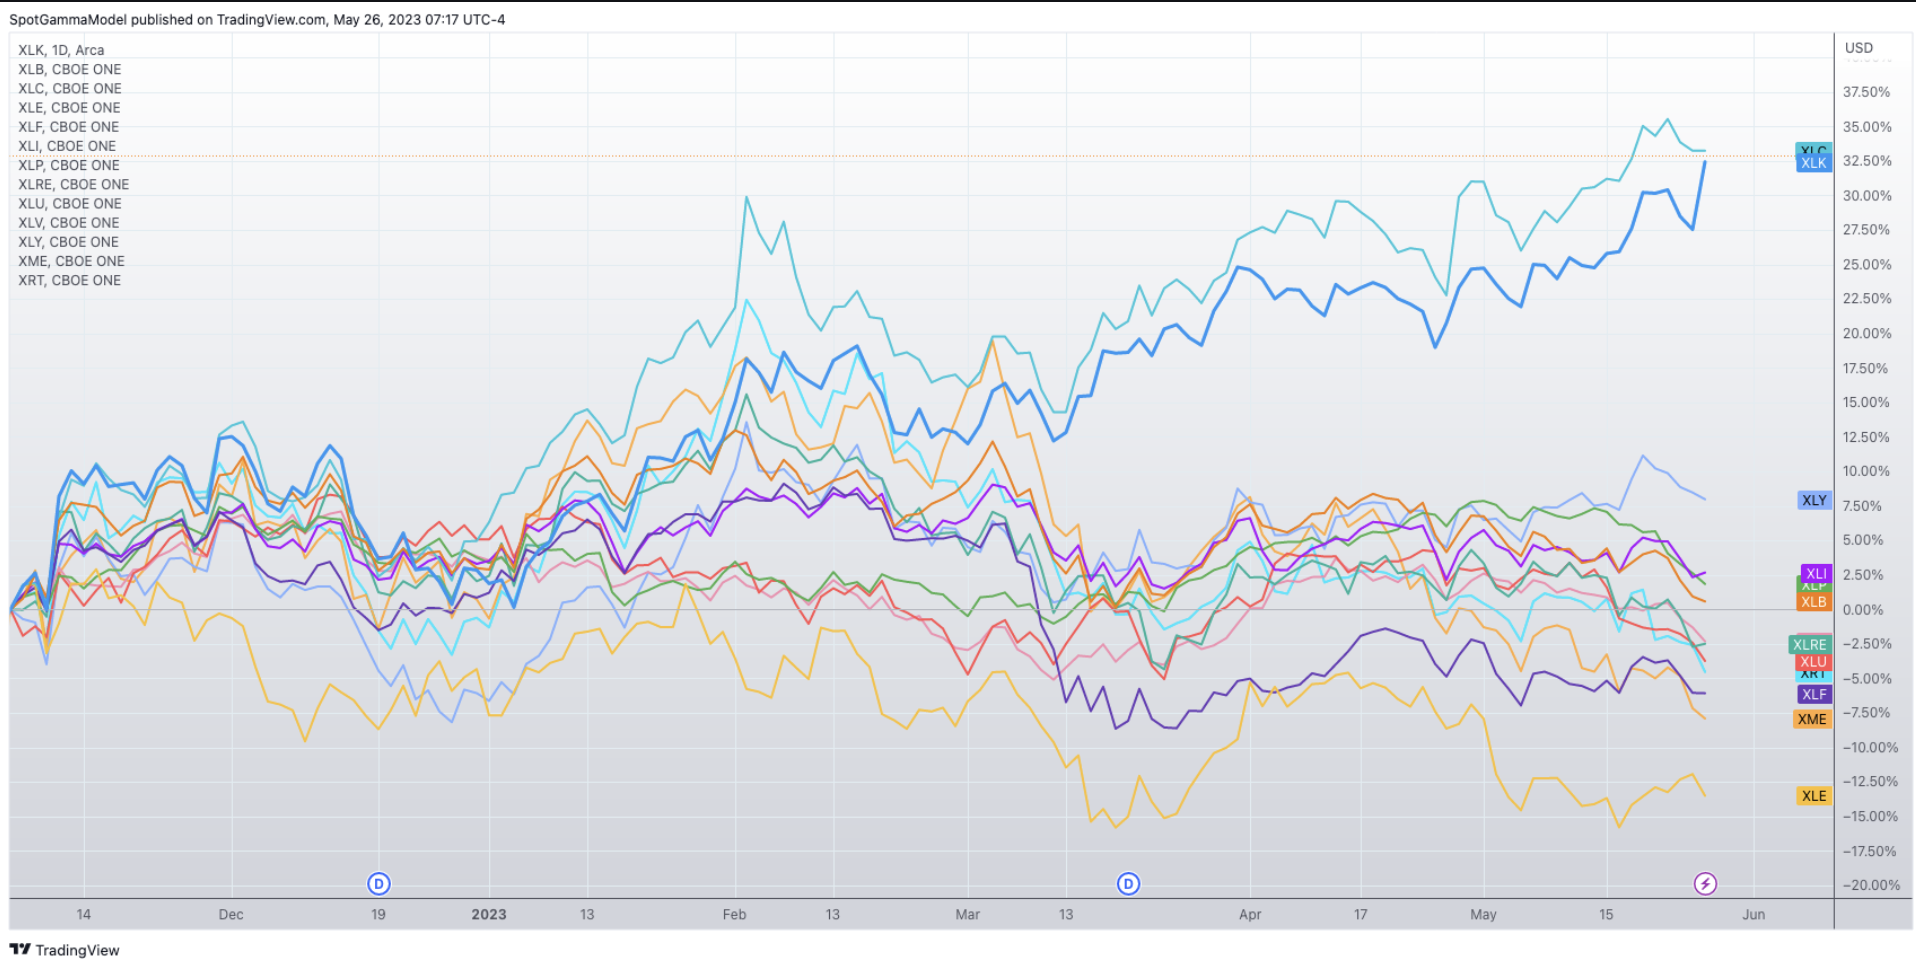
What’s odd here is that divergence we marked between QQQ and IWM that started after the March bank crisis. Its not that tech is simply outpacing other US equity sectors gains, its that its the only thing that’s going up.
To illustrate this point below are the various sector select ETF’s and as you can see, XLK (tech) and XLC (communication services) are heavily outpacing everything else after March. In line with this are the Call Walls, which see QQQ’s rolling higher & higher while S&P’s stall.
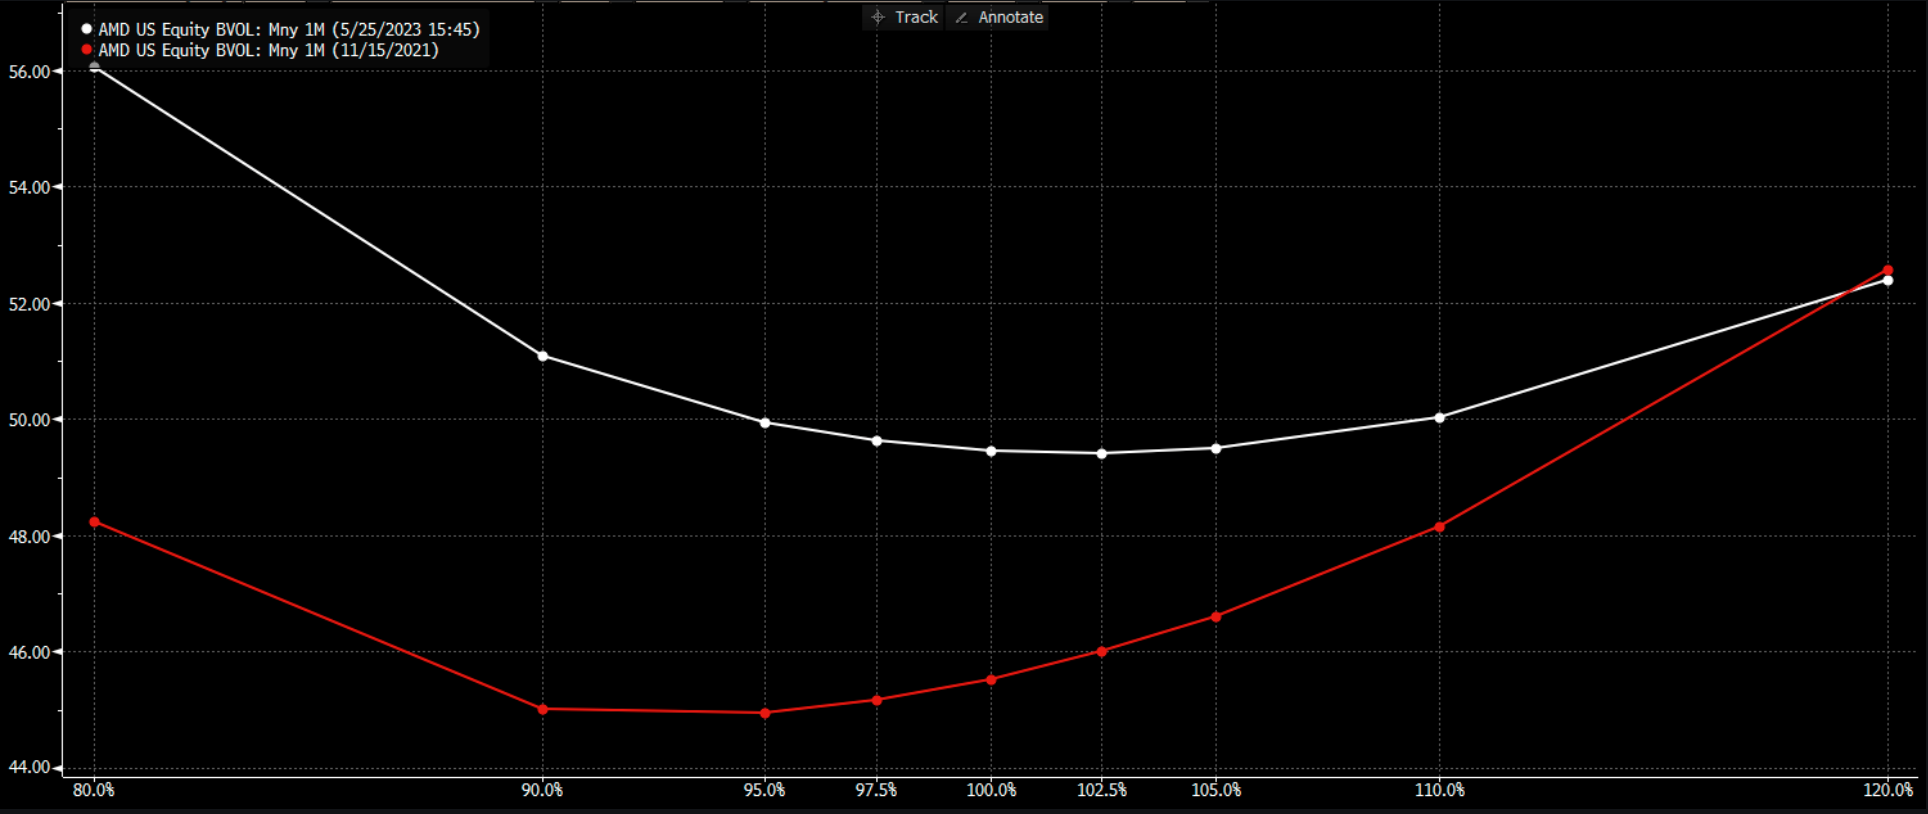
This outperformance is being heavily reflected in implied volatilities. Consider the difference in skew between QQQ & SPY which implies there is more of a long call grab in tech – which is probably stating the obvious. As the tech outpeformance continues, it commands more attention as its apparently the only game in town. If you simply own SPY you risk being left behind, so you allocate to tech longs.

As a top example, below is today’s skew for AMD (white), and as you can see the upside strikes have increasingly higher IV’s which reflect the speculation that the mania will continue. We’ve also added the skew for AMD back on 11/15/21 (red), when the stock was nearing all time highs of $160 (vs $120 today). Back in Nov ’21 those upside strikes carried a much higher relative vol which reflects that frothing call demand in 2021.
Our immediate reaction to this comparison was “there may currently be more crazy upside left in the tank”.
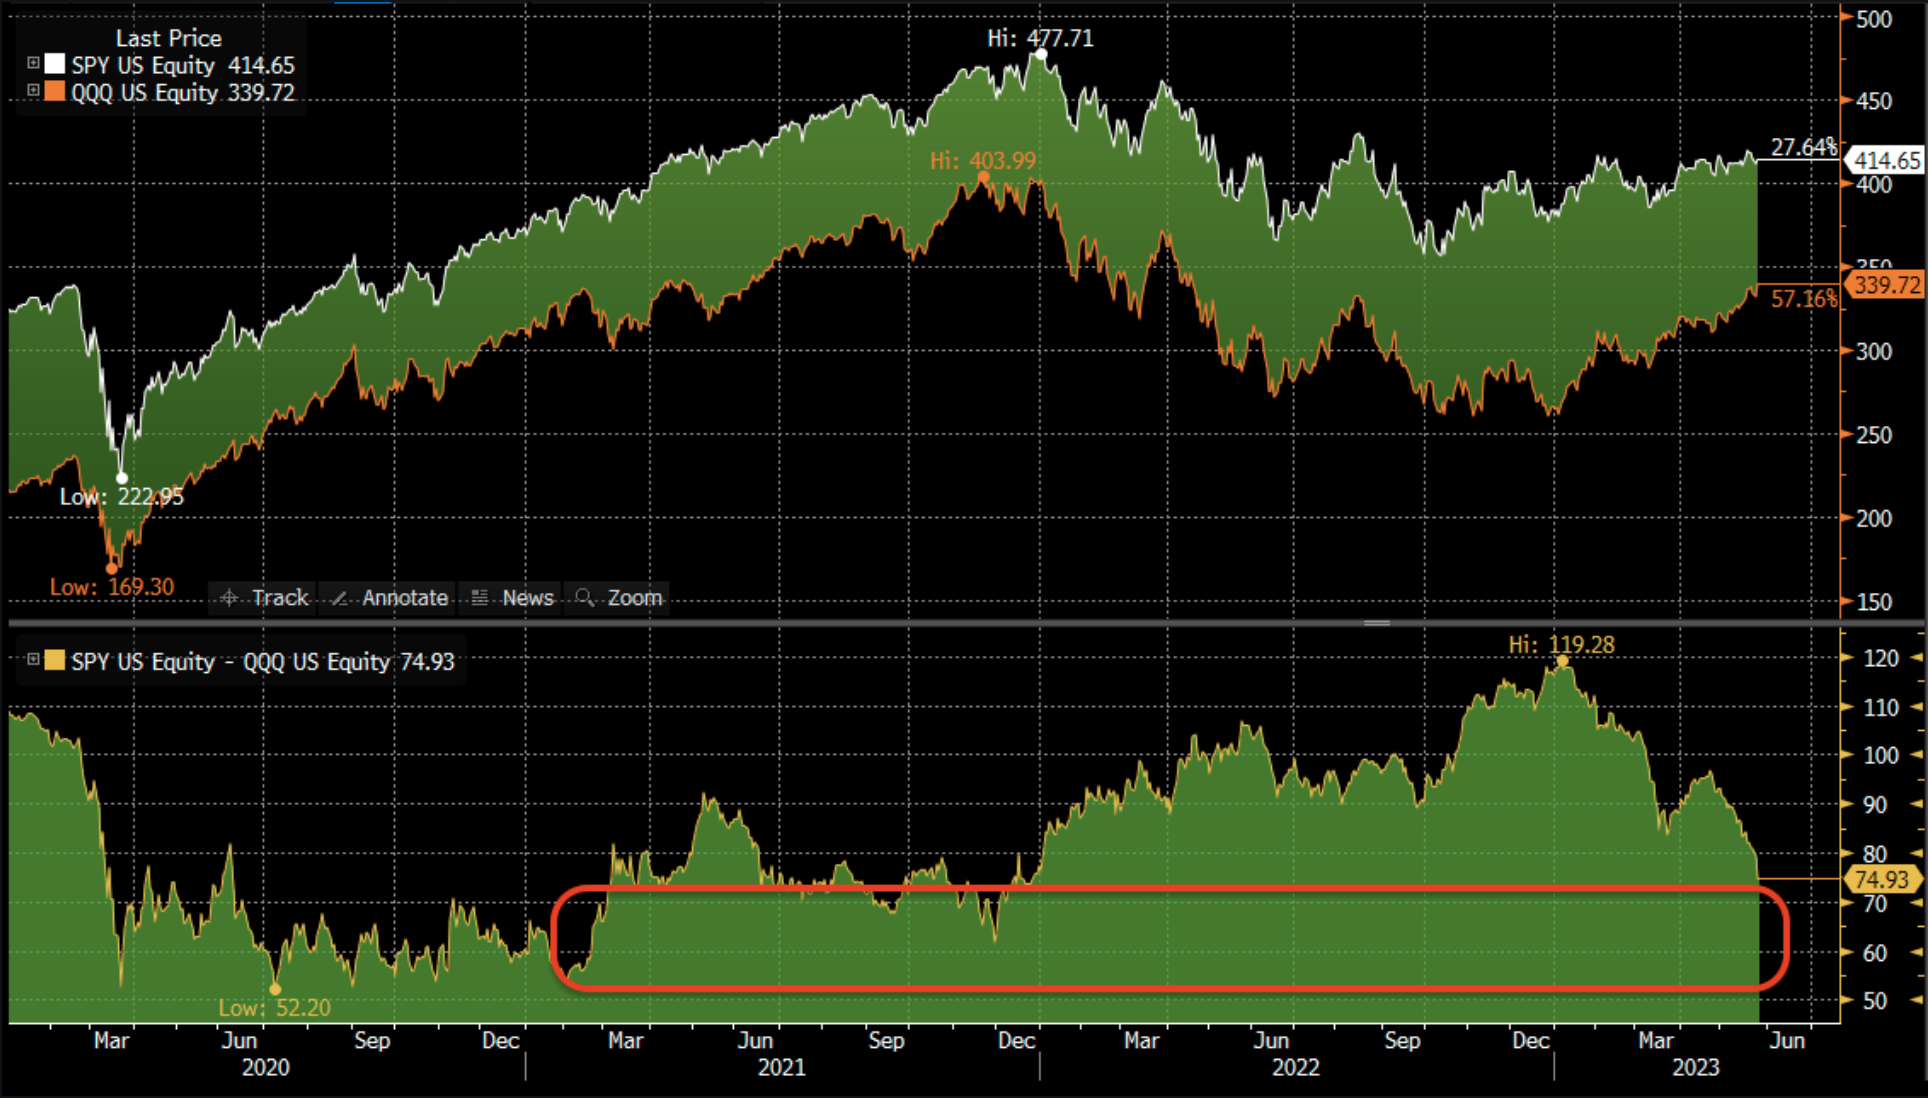
This chart is of the spread between SPY & QQQ, via Bloomberg. To this point of “maybe a bit more is left in tech”, the bottom chart suggests that we are only now getting to the area wherein the spread has been post March ’20.
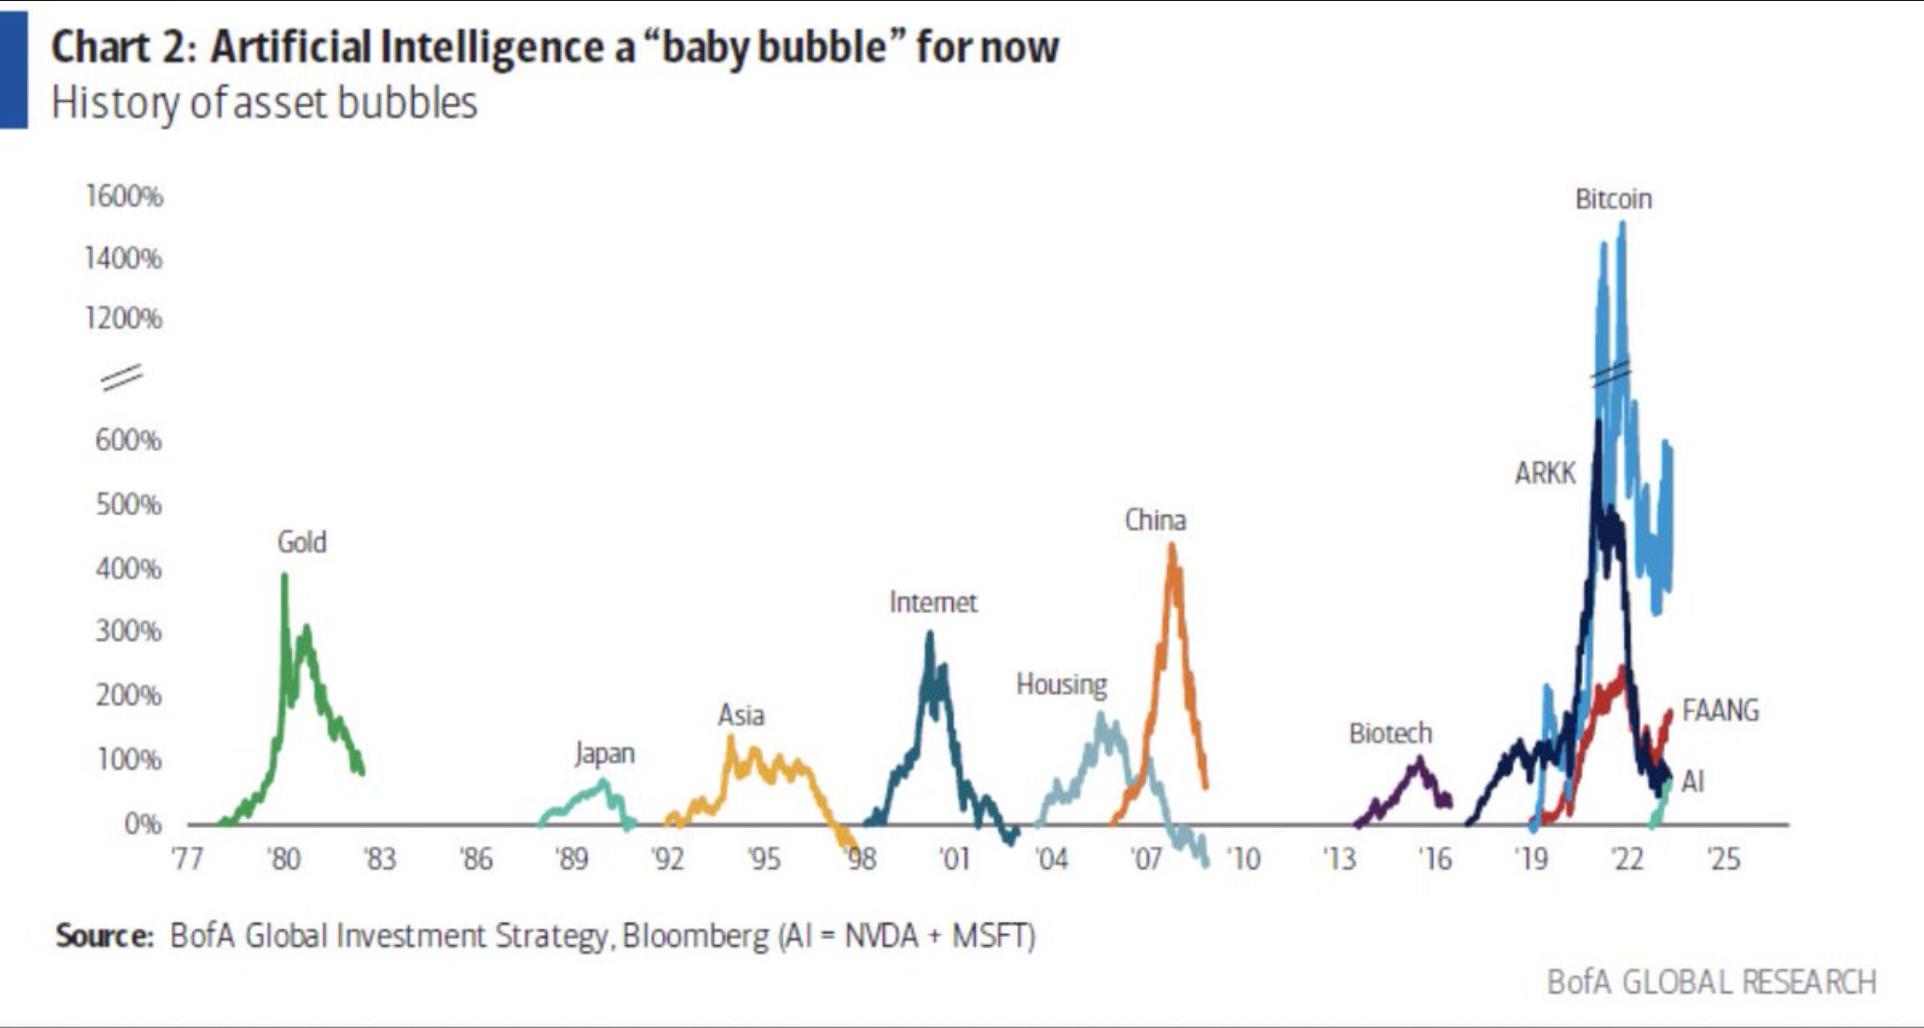
Finally, we came across this chart from BOFA (h/t DA) which compares relative bubbles. It frames AI as a “baby bubble”, which is how would could frame the call skew from above. One can’t help wonder that if a debt deal is signed – does that unleash a final crescendo into tech?
| SpotGamma Proprietary Levels | SPX | SPY | NDX | QQQ | RUT | IWM |
|---|---|---|---|---|---|---|
| Reference Price: | $4151 | $414 | $13937 | $339 | $1754 | $174 |
| SpotGamma Implied 1-Day Move: | 0.84% | 0.84% |
|
|
|
|
| SpotGamma Implied 5-Day Move: | 2.20% |
|
|
|
|
|
| SpotGamma Volatility Trigger™: | $4135 | $415 | $12875 | $337 | $1770 | $175 |
| Absolute Gamma Strike: | $4000 | $412 | $13850 | $340 | $1800 | $175 |
| SpotGamma Call Wall: | $4200 | $420 | $13850 | $350 | $1790 | $180 |
| SpotGamma Put Wall: | $4000 | $400 | $11000 | $300 | $1650 | $170 |
| Additional Key Levels | SPX | SPY | NDX | QQQ | RUT | IWM |
|---|---|---|---|---|---|---|
| Zero Gamma Level: | $4127 | $417 | $12605 | $336 | $1873 | $182 |
| Gamma Tilt: | 1.117 | 0.785 | 2.439 | 1.097 | 0.694 | 0.559 |
| SpotGamma Gamma Index™: | 0.604 | -0.229 | 0.083 | 0.027 | -0.024 | -0.087 |
| Gamma Notional (MM): | $62.181M | ‑$1.106B | $11.756M | $78.331M | ‑$25.741M | ‑$905.839M |
| 25 Day Risk Reversal: | -0.076 | -0.079 | -0.056 | -0.053 | -0.062 | -0.071 |
| Call Volume: | 435.623K | 2.316M | 9.717K | 835.277K | 18.649K | 506.18K |
| Put Volume: | 703.553K | 2.46M | 10.055K | 1.266M | 26.297K | 541.116K |
| Call Open Interest: | 6.392M | 7.016M | 70.016K | 4.545M | 201.996K | 3.622M |
| Put Open Interest: | 12.299M | 13.936M | 59.41K | 9.059M | 354.081K | 7.609M |
| Key Support & Resistance Strikes |
|---|
| SPX Levels: [4200, 4150, 4100, 4000] |
| SPY Levels: [420, 415, 412, 410] |
| NDX Levels: [14500, 14000, 13850, 13000] |
| QQQ Levels: [340, 338, 335, 330] |
| SPX Combos: [(4351,92.29), (4326,89.10), (4321,90.51), (4301,98.81), (4280,75.94), (4276,92.71), (4259,77.52), (4255,80.77), (4251,97.30), (4234,78.76), (4230,75.64), (4226,96.53), (4222,84.43), (4214,75.87), (4209,89.82), (4205,90.43), (4201,98.97), (4189,96.08), (4184,93.25), (4180,81.29), (4176,90.03), (4151,82.57), (4131,92.18), (4126,97.10), (4118,75.67), (4106,78.90), (4101,87.09), (4085,78.09), (4056,85.17), (4052,93.76), (4027,82.60), (4006,88.99), (4002,97.62), (3977,77.54), (3952,92.33)] |
| SPY Combos: [433.29, 423.34, 403.02, 408] |
| NDX Combos: [13853, 14355, 13951, 14160] |
| QQQ Combos: [346.07, 348.45, 333.15, 338.25] |
0 comentarios