Macro Theme:
Short Term Resistance: 4,465 (SPY Call Wall)
Short Term Support: 4,450
Risk Pivot Level: 4,400
Major Range High/Resistance: 4,500 Call Wall
Major Range Low/Support: 4,000 Put Wall
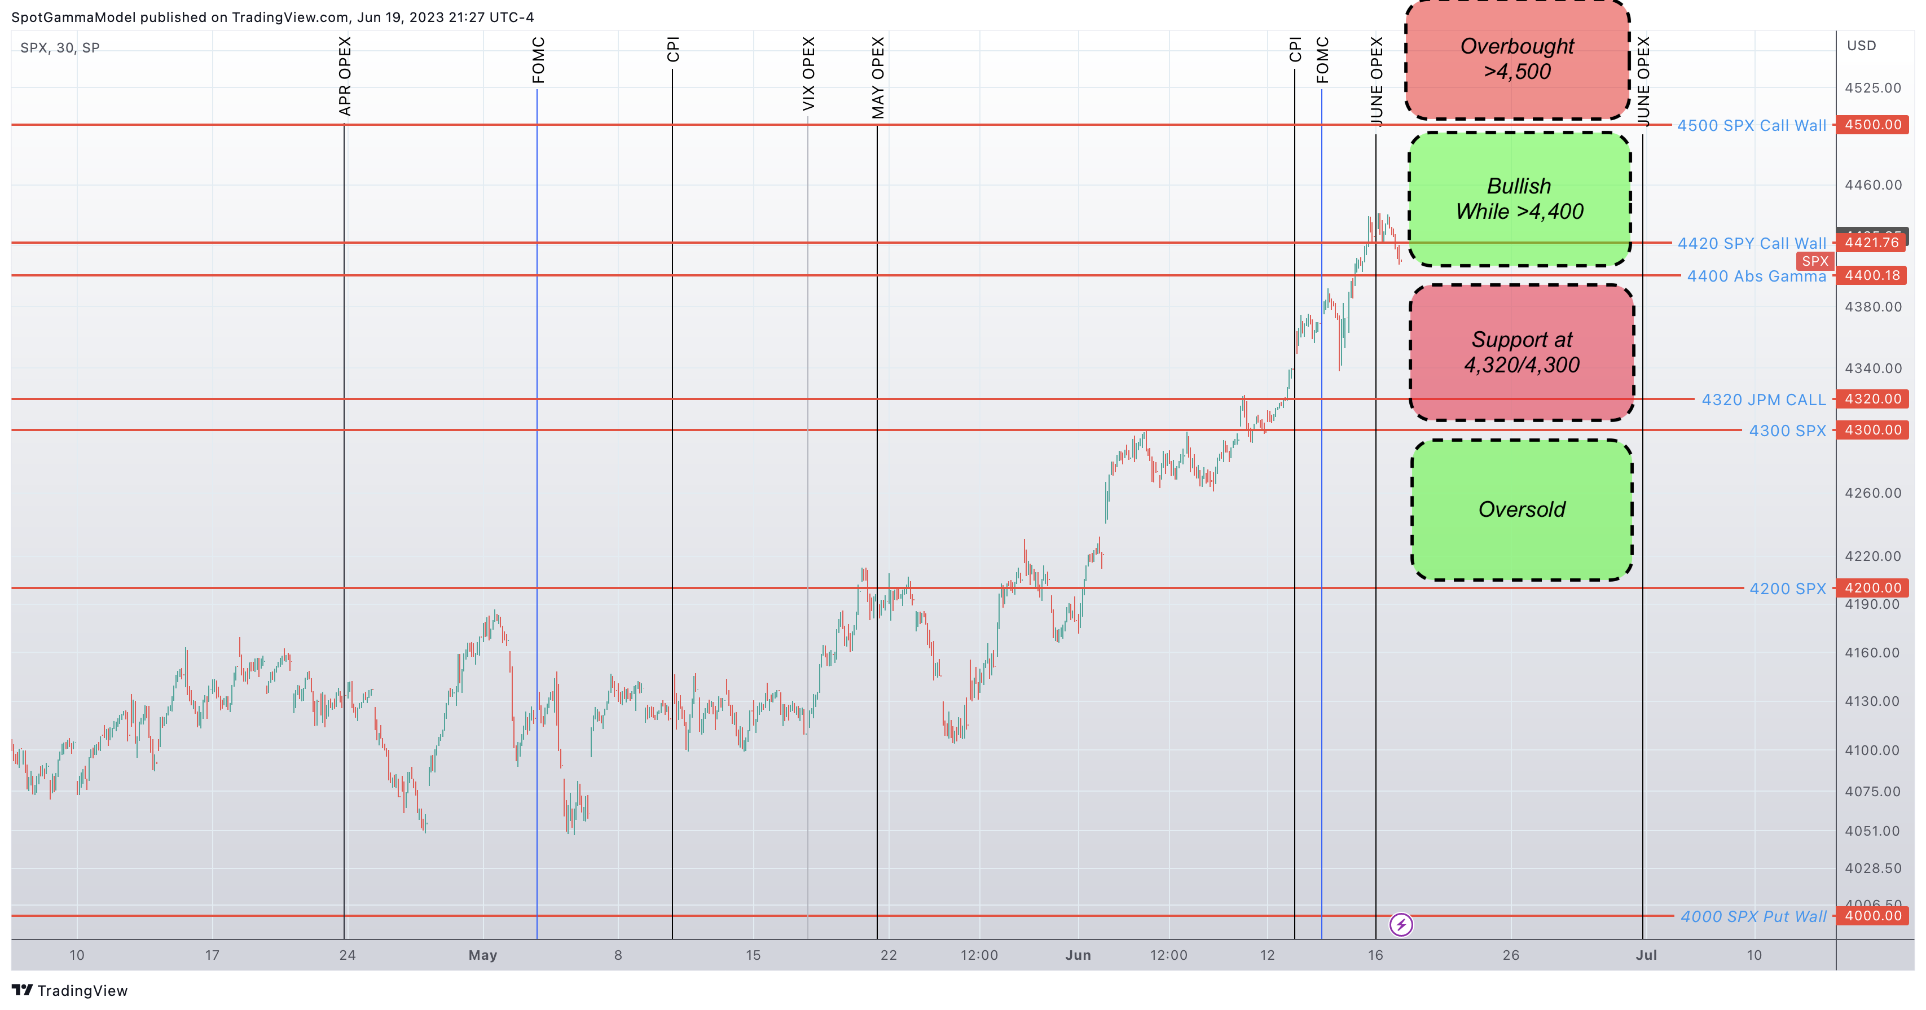
‣ We maintain a bullish stance while the SPX is >4,400 and below the 4,500 Call Wall (updated: 7/3/23)
‣ We anticipate declining market volatility into 7/21 July OPEX (updated: 7/3/23)
‣ A downside break of 4,400 is our “risk off” signal (updated: 7/3/23)
Founder’s Note:
Futures are flat to Friday’s close at 4,480 ahead of today’s holiday-shortened session (close 1PM ET). 4,500 is now the Call Wall in the SPX, and the top of our trading range. First, the S&P has to contend with upside resistance at the 4,468 (SPY Call Wall) & 4,477. Support below shows at 4,450, then 4,424.
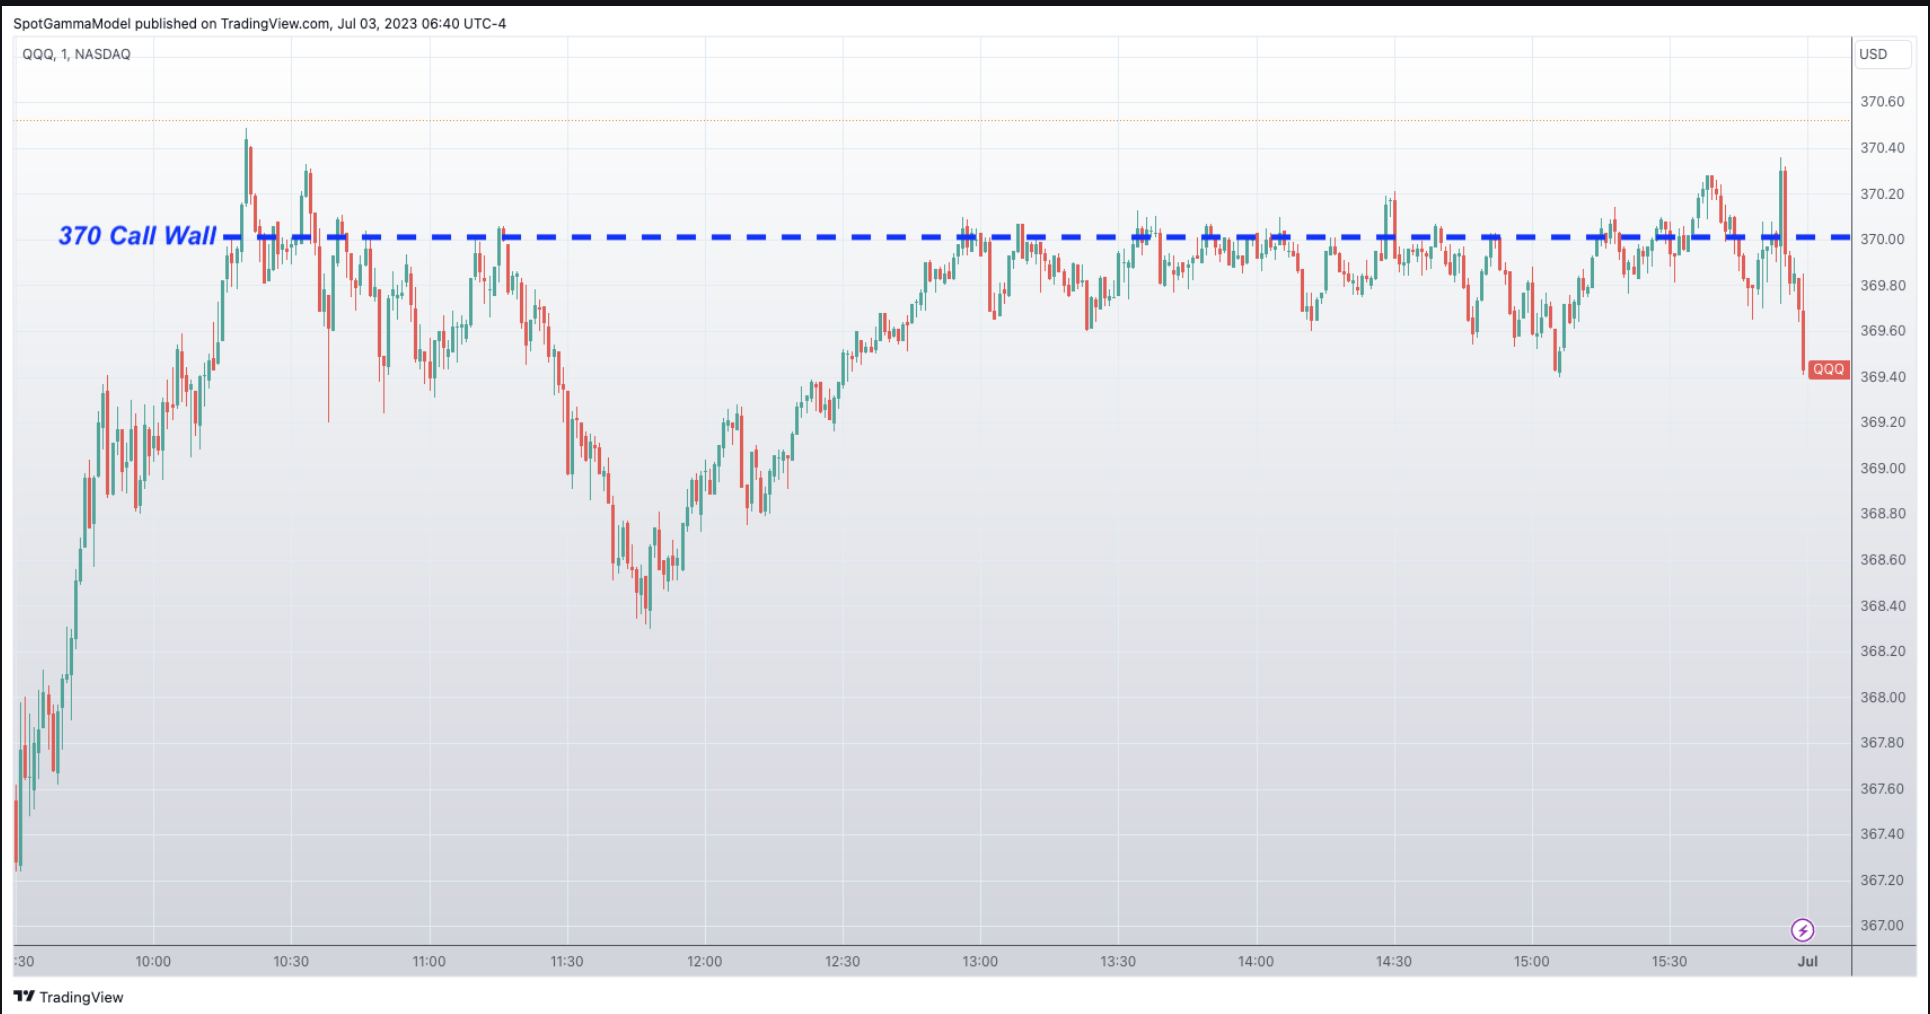
In QQQ the Call Wall holds at 370, with support at 365.
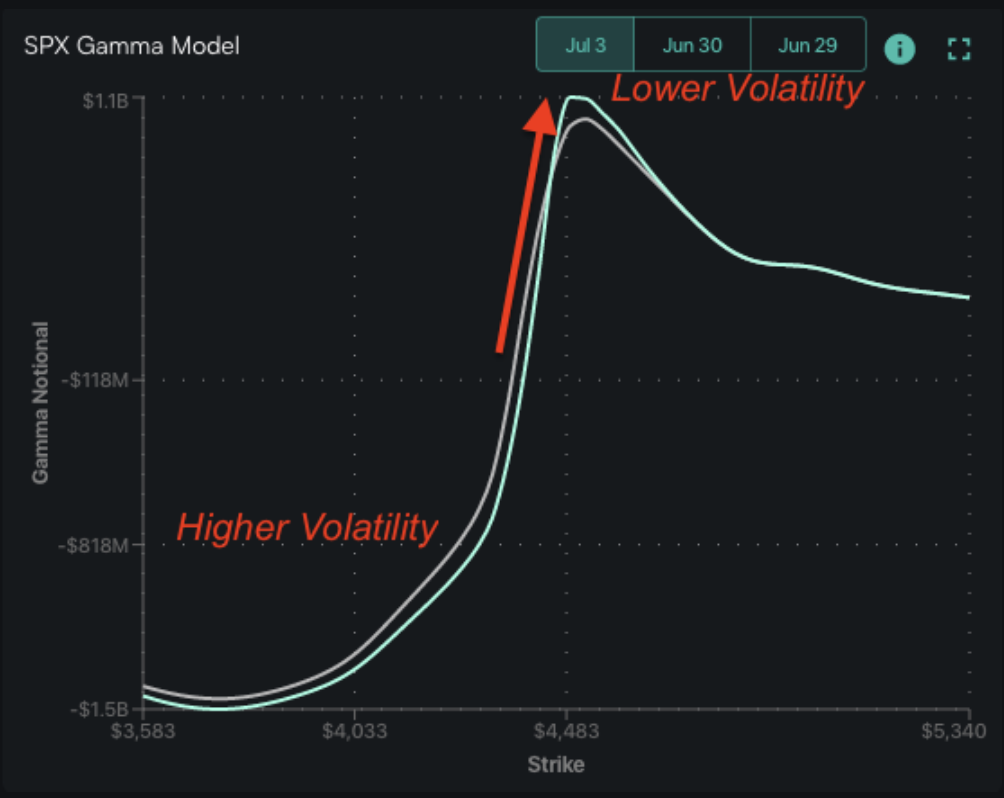
For the S&P500, the major feature of this market is large positive gamma. The impact of this is that volatility should continue to contract, which inherently supports equity prices. Should the market continue to slide higher into 4,500, the intraday trading ranges should grind lower due to that heavy existing call gamma. Additionally, new options positions should come in around current at-the-money Index levels, which helps to reinforce the lower volatility environment. Accordingly, our SG implied 1 day move is currenly 81bps, and we would look for that to contract over the coming days.
From a high level we view this as part of a cycle that should peak into July OPEX week 7/17-/21. Then, with OPEX, a large chunk of these positive gamma positions should clear out, which allows volatility to increase.
Lower volatility has obvious implications for options traders, but also futures traders (tighter trading ranges), and portfolio hedgers. We’d argue that the market is less likely to experience large, sudden declines in these environments (see Friday’s note, and this plot) which may hurt the performance of long puts. If/when the S&P trades to near its Vol Trigger (i.e. the gamma flip point), we believe risk shifts materially higher which may justify holding larger relative hedge positions.
The SPX typically moves towards the Vol Trigger by either declining in price (which, in the current environment would likely take several sessions), or through the removal of large positions at OPEX.
As an example of these tighter intraday ranges, the S&P popped +1.2% higher on Friday, but only 50bps of that was due to the cash session. It was a similar picture in the QQQ, which was +1.6% close/close, with only +60bps coming from intraday trading.
Further, there was very clearly some large entity with a big offer at 370, as shown below (370 was a literal Call Wall). We bring this up here as, despite Fridays bullishness, the QQQ Call Wall failed to roll higher, and we saw rather large put buying VIA HIRO. This was in contrast to the S&P500 which saw fairly large bullish HIRO flows, and higher Call Walls.
This divergence in performance may be worth noting as the relative performance over the previous quarter was led by QQQ: +17.7%, SPY +10.2%, IWM +6.2%.
In summary, for the S&P we remain bullish while prices hold >4,400 and below the 4,500 Call Wall. If we hit the Call Wall our stance shifts to neutral. Our “risk off” signal triggers with a break of 4,400.
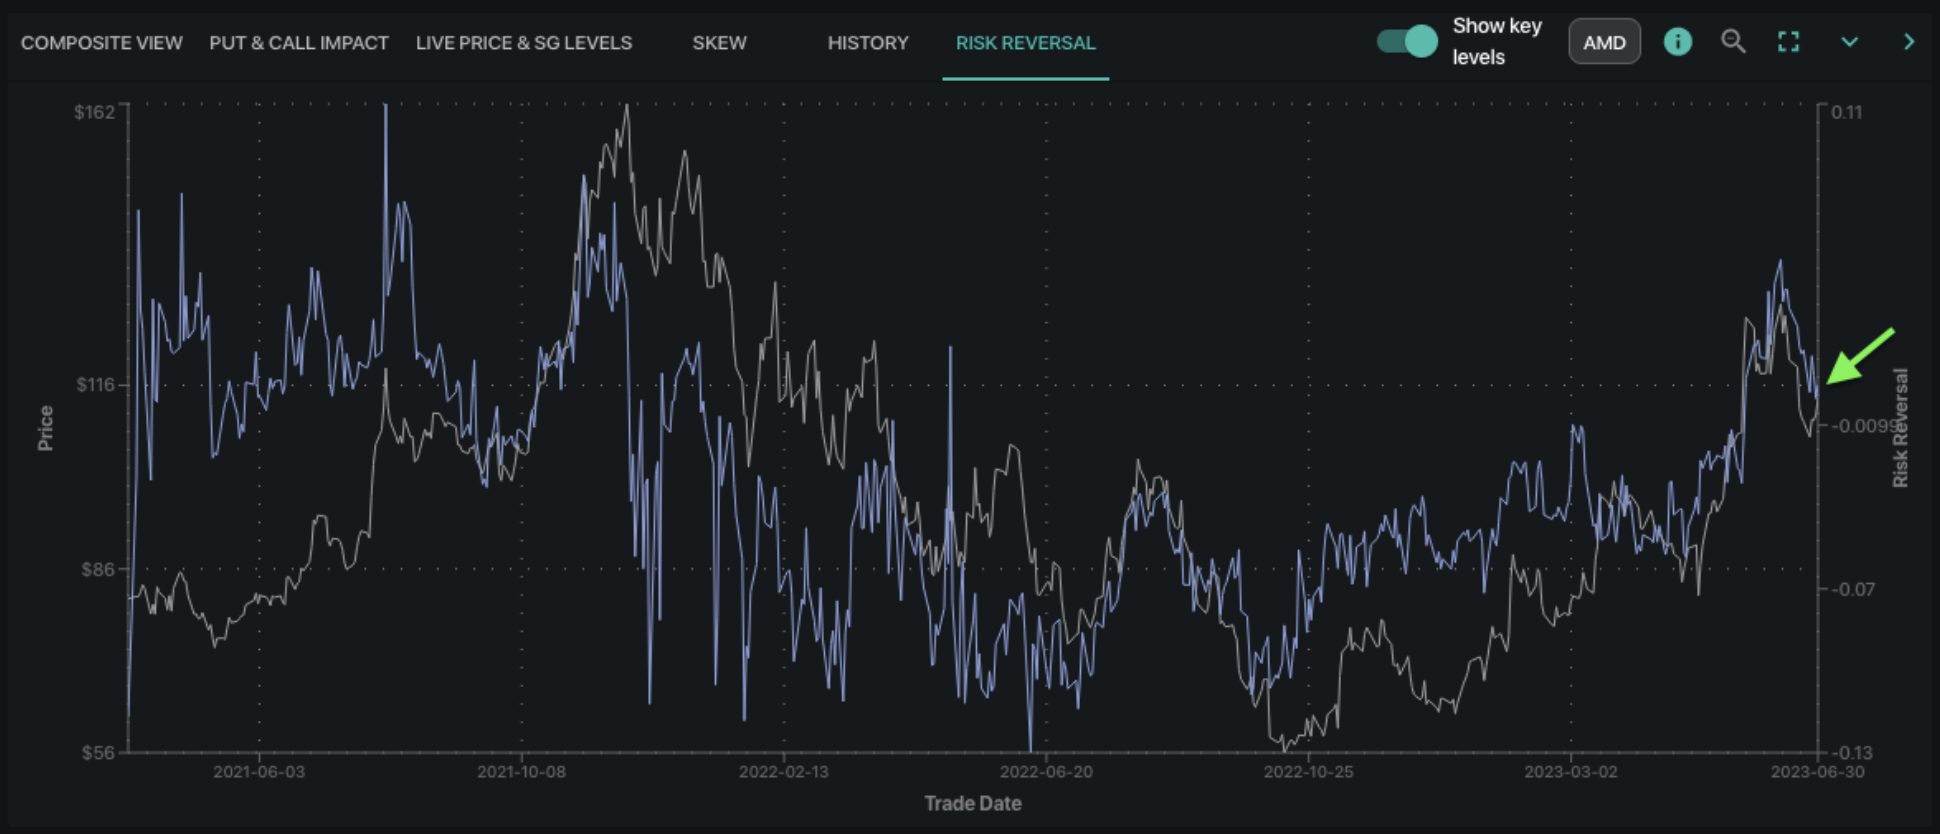
Over to single stocks, wherein the performance of top names picked up last week. We have been bullish on “the leaders” (i.e. AI/tech & megacap) based on the contraction of call implied volatility after June OPEX (see here, here). Currently, we see call skews remaining fairly reasonable, and a build in call positions overhead. For these reasons we maintain a bullish stance in these top names.
| SpotGamma Proprietary Levels | SPX | SPY | NDX | QQQ | RUT | IWM |
|---|---|---|---|---|---|---|
| Reference Price: | $4450 | $443 | $15179 | $369 | $1888 | $187 |
| SpotGamma Implied 1-Day Move: | 0.81% | 0.81% |
|
|
|
|
| SpotGamma Implied 5-Day Move: | 2.13% |
|
|
|
|
|
| SpotGamma Volatility Trigger™: | $4395 | $441 | $14800 | $368 | $1850 | $186 |
| Absolute Gamma Strike: | $4400 | $440 | $15200 | $370 | $1880 | $190 |
| SpotGamma Call Wall: | $4500 | $445 | $15200 | $370 | $1880 | $190 |
| SpotGamma Put Wall: | $4200 | $420 | $14475 | $330 | $1820 | $180 |
| Additional Key Levels | SPX | SPY | NDX | QQQ | RUT | IWM |
|---|---|---|---|---|---|---|
| Zero Gamma Level: | $4391 | $442 | $14042 | $366 | $1870 | $187 |
| Gamma Tilt: | 1.374 | 1.035 | 2.797 | 1.10 | 1.044 | 0.970 |
| SpotGamma Gamma Index™: | 1.423 | 0.029 | 0.104 | 0.029 | 0.003 | -0.004 |
| Gamma Notional (MM): | $746.588M | $150.867M | $12.677M | $135.56M | $3.566M | $5.314M |
| 25 Day Risk Reversal: | -0.034 | -0.027 | -0.025 | -0.025 | -0.027 | -0.022 |
| Call Volume: | 707.575K | 1.864M | 8.352K | 656.192K | 41.101K | 441.219K |
| Put Volume: | 1.306M | 3.116M | 7.664K | 1.173M | 49.309K | 443.707K |
| Call Open Interest: | 5.469M | 6.056M | 57.019K | 4.006M | 198.905K | 3.421M |
| Put Open Interest: | 11.853M | 13.063M | 63.948K | 8.758M | 358.212K | 6.899M |
| Key Support & Resistance Strikes |
|---|
| SPX Levels: [4500, 4450, 4400, 4300] |
| SPY Levels: [444, 443, 442, 440] |
| NDX Levels: [15200, 15150, 15125, 15000] |
| QQQ Levels: [370, 365, 360, 350] |
| SPX Combos: [(4664,87.51), (4651,88.45), (4624,74.61), (4602,97.81), (4575,90.47), (4571,75.97), (4548,97.77), (4539,76.01), (4526,96.64), (4522,74.55), (4517,87.84), (4508,81.36), (4499,99.82), (4490,84.70), (4486,85.08), (4482,87.93), (4477,99.12), (4468,93.54), (4459,87.65), (4450,97.09), (4424,86.29), (4401,89.86), (4348,81.87), (4250,83.16)] |
| SPY Combos: [443.69, 448.57, 453.89, 445.91] |
| NDX Combos: [15194, 15210, 15285, 15407] |
| QQQ Combos: [376.6, 361.41, 375.48, 374.74] |
0 comentarios