Macro Theme:
Short Term Resistance: 4,500
Short Term Support: 4,425
Risk Pivot Level: 4,400
Major Range High/Resistance: 4,600 – 4,615 (SPY 460/SPX 4,600 Call Wall(s))
Major Range Low/Support: 4,300
‣ IV Ranking suggests many significant single stocks have their lowest IV’s in months, which may be an effective way to play directional movement out of 8/16 – 8/18 expiration**
‣ Current positioning suggests 4,400 would be a major interim low, with traders likely taking a directional cue from Jackson Hole on 8/24-8/26*
‣ We look for a strong directional move out of Jackson Hole on 8/24-8/26*
‣ <4,300 would be a significant “risk off” as dealer negative gamma increases*
*updated 8/21
**updated 8/16
Founder’s Note:
ES futures have shifted 50bps higher to 4,425. Resistance for today is at 4,400 – 4,410 (Vol Trigger, SPY440). We do not mark resistance above 4,410 until 4,450. Support below is at 4,374 & 4,350. Our 1 day implied move remains at 0.79%.
For QQQ, support is at 360, with resistance at 370.
We anticipate that the S&P will continue to feed back into the 4,400 level through Friday’s Jackson Hole events. This reversion should work not only for the downside, like yesterday, but also for the upside.

While yesterday started off with non-0DTE put flow weighing on markets, it was 0DTE that brought it back. We measure 52% of total SPX volume in 0DTE, and as you can see below that flow (teal) had a strong positive delta trend from 1PM ET on. What is interesting here is that flow from all expirations (purple) was rather neutral. Now, as 0DTE flow is included in the “All Exp” signal, that means that traders were buying longer dated downside throughout the afternoon rally.
This relates back to the idea that short term flows are in control until Jackson Hole and longer term, directional flows may unlock. These short term flows are strong, but fickle, which means they can break trend rather quickly.

Lastly we wanted to again draw attention to what we think is the most unique aspect of this current market – that of single stock IV’s. After filtering for names with large open interest (>50k), we find that the average IV rank is just 18% (over last 250 days). This suggest these IV’s are the lowest over the last year.
Many major names like AAPL and TSLA have IV ranks around 10%, despite large drawdowns. We continue to like being long single stock vols at these levels, as we antipate either long options demand to pick up with a directional move into Sep OPEX.

|
SpotGamma Proprietary Levels |
SPX |
SPY |
NDX |
QQQ |
RUT |
IWM |
|---|---|---|---|---|---|---|
|
Reference Price: |
$4400 |
$439 |
$14936 |
$363 |
$1856 |
$184 |
|
SpotGamma Implied 1-Day Move: |
0.79% |
0.79% |
|
|
|
|
|
SpotGamma Implied 5-Day Move: |
2.13% |
|
|
|
|
|
|
SpotGamma Volatility Trigger™: |
$4410 |
$437 |
$14575 |
$363 |
$1850 |
$190 |
|
Absolute Gamma Strike: |
$4400 |
$440 |
$14625 |
$360 |
$1900 |
$185 |
|
SpotGamma Call Wall: |
$4600 |
$441 |
$14625 |
$400 |
$1860 |
$210 |
|
SpotGamma Put Wall: |
$4300 |
$430 |
$12500 |
$350 |
$1750 |
$185 |
|
Additional Key Levels |
SPX |
SPY |
NDX |
QQQ |
RUT |
IWM |
|---|---|---|---|---|---|---|
|
Zero Gamma Level: |
$4441 |
$445 |
$14134 |
$371 |
$1996 |
$195 |
|
Gamma Tilt: |
0.779 |
0.687 |
1.222 |
0.747 |
0.666 |
0.431 |
|
SpotGamma Gamma Index™: |
-1.41 |
-0.343 |
0.023 |
-0.11 |
-0.03 |
-0.118 |
|
Gamma Notional (MM): |
‑$648.546M |
‑$1.547B |
$3.366M |
‑$580.264M |
‑$28.992M |
‑$1.225B |
|
25 Day Risk Reversal: |
-0.058 |
-0.061 |
-0.054 |
-0.058 |
-0.039 |
-0.045 |
|
Call Volume: |
465.892K |
1.639M |
9.783K |
828.45K |
13.495K |
172.353K |
|
Put Volume: |
793.282K |
2.368M |
15.579K |
1.203M |
33.467K |
344.588K |
|
Call Open Interest: |
6.065M |
6.494M |
58.418K |
4.578M |
209.947K |
3.491M |
|
Put Open Interest: |
12.635M |
13.408M |
75.177K |
9.394M |
378.955K |
7.235M |
|
Key Support & Resistance Strikes |
|---|
|
SPX Levels: [4500, 4450, 4400, 4300] |
|
SPY Levels: [450, 440, 435, 430] |
|
NDX Levels: [15500, 15000, 14625, 14000] |
|
QQQ Levels: [370, 365, 360, 350] |
|
SPX Combos: [(4603,89.56), (4576,77.43), (4550,82.83), (4523,81.16), (4449,83.59), (4400,87.07), (4374,88.68), (4365,87.40), (4356,87.73), (4352,97.23), (4347,84.43), (4339,85.57), (4325,93.09), (4321,84.17), (4317,76.55), (4308,87.90), (4303,74.72), (4299,97.43), (4281,75.81), (4277,83.43), (4255,82.08), (4251,93.97), (4224,79.44), (4211,87.76), (4207,73.82), (4202,96.94)] |
|
SPY Combos: [432.31, 437.14, 422.21, 434.95] |
|
NDX Combos: [14623, 14369, 14772, 14578] |
|
QQQ Combos: [362.26, 355.71, 350.61, 360.81] |
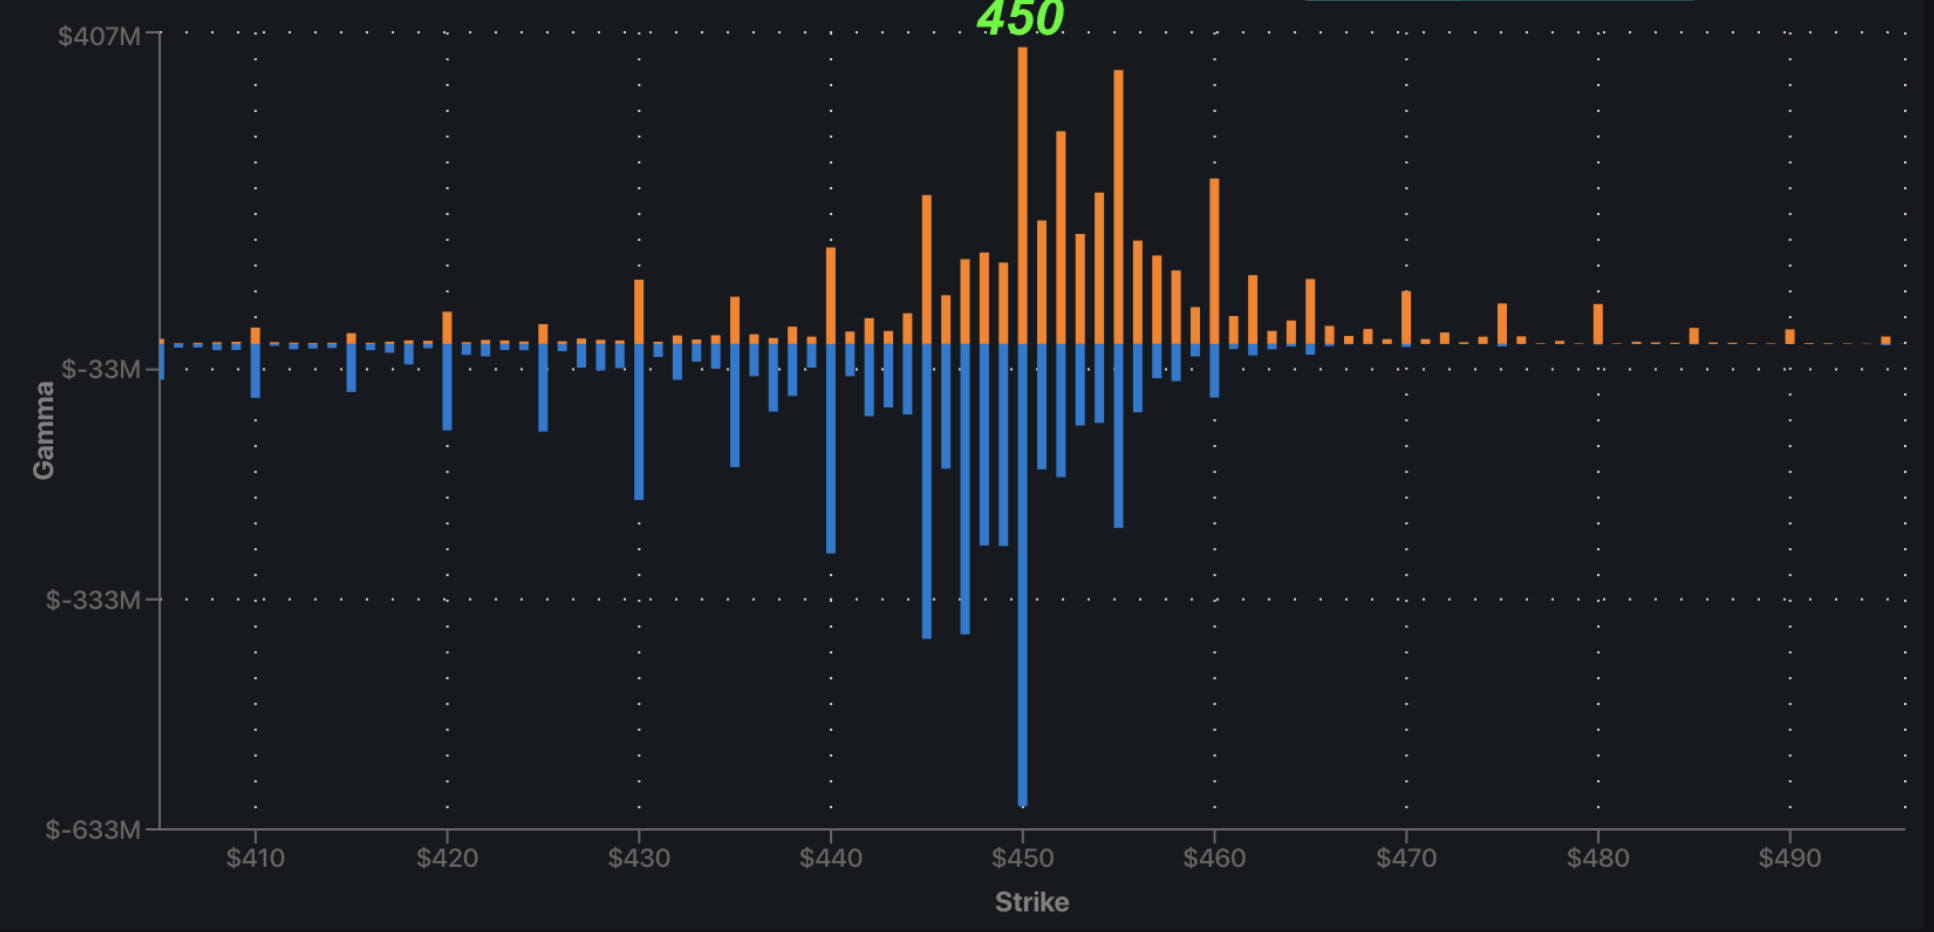
SPX Gamma Model
View All Indices Charts