Macro Theme:
Short Term Resistance: 4,500
Short Term Support: 4,425
Risk Pivot Level: 4,400
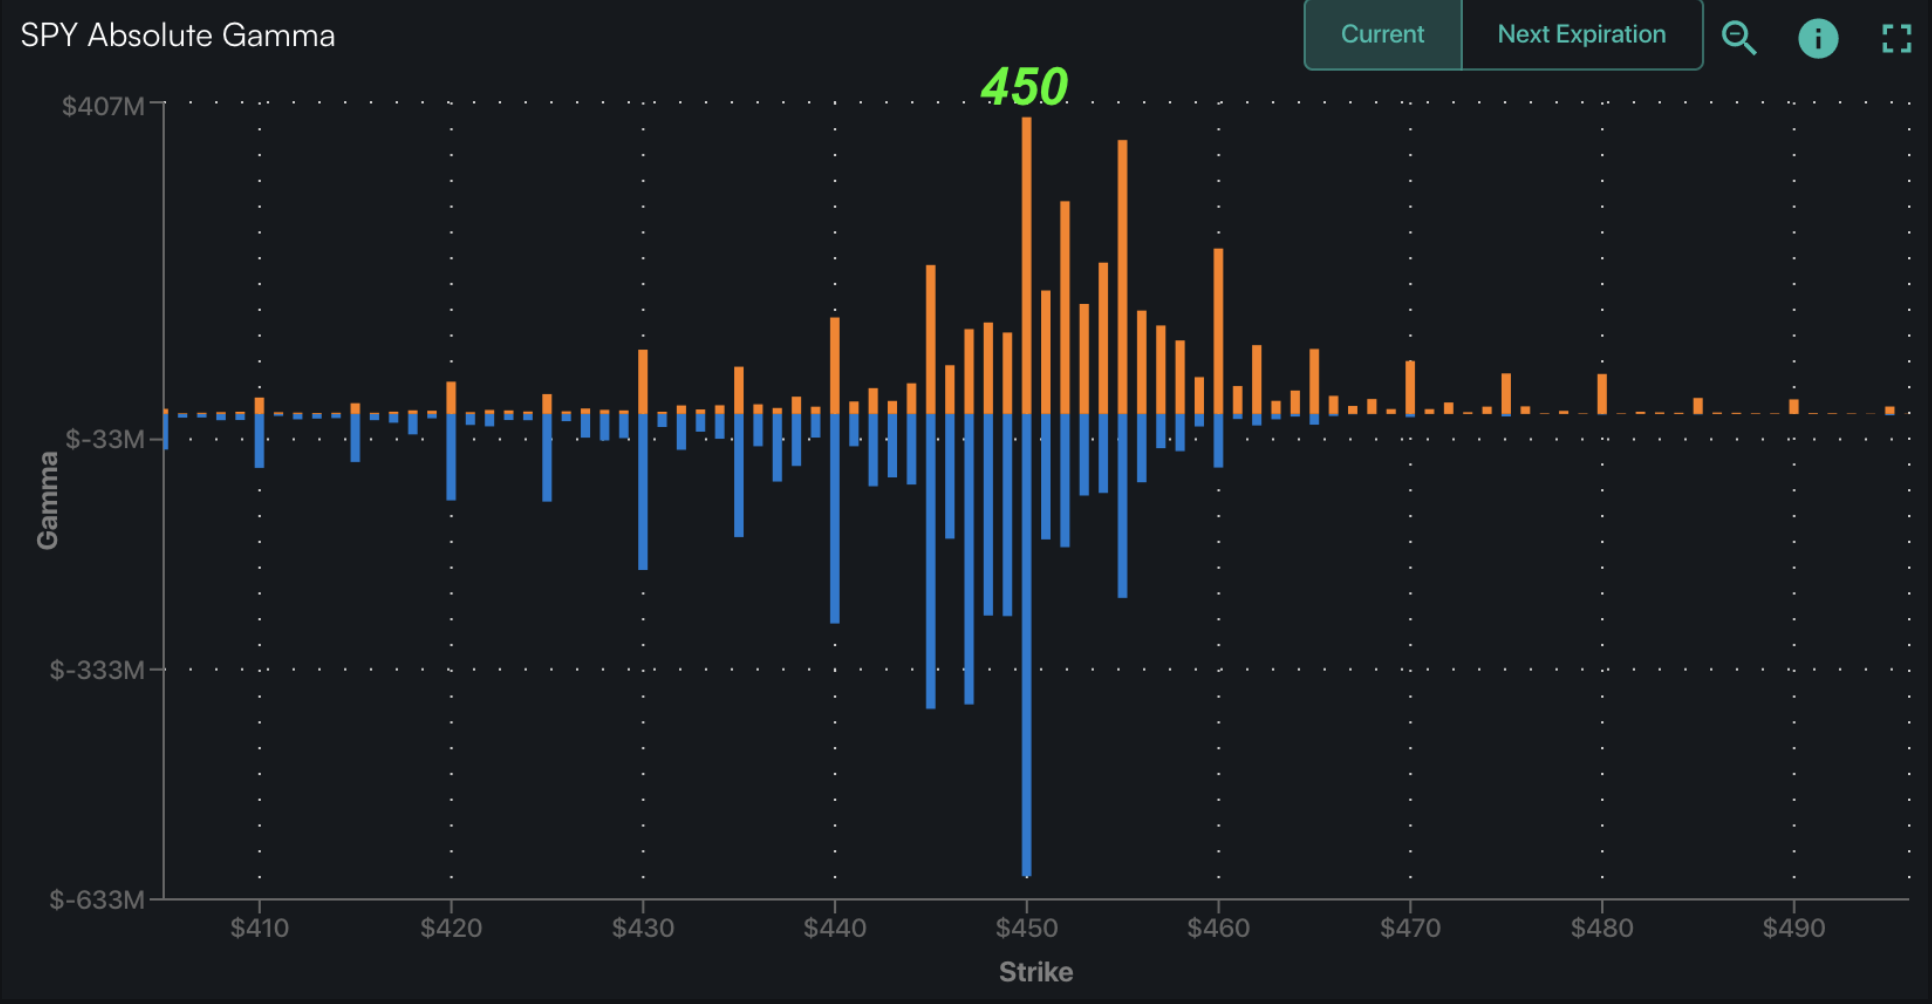
Major Range High/Resistance: 4,600 – 4,615 (SPY 460/SPX 4,600 Call Wall(s))
Major Range Low/Support: 4,300
‣ IV Ranking suggests many significant single stocks have their lowest IV’s in months, which may be an effective way to play directional movement out of 8/16 – 8/18 expiration**
‣ Current positioning suggests 4,400 would be a major interim low, with traders likely taking a directional cue from Jackson Hole on 8/24-8/26*
‣ We look for a strong directional move out of Jackson Hole on 8/24-8/26*
*updated 8/21
**updated 8/16
Founder’s Note:
ES futures are marginally higher to 4,395 ahead of Powell’s 10AM appearance. Key support is at the 4350 SPX
Put Wall,
& 4310 (SPY SPY Put Wall). Resistance above is at 4,400 – 4,410 (SPY 440), then 4,450. The 1 day open/close implied move is at 0.76%. However, given Powell’s speech and the elevated IV’s this range may likely be violated.
In QQQ support is at the 360
Put Wall.
Resistance above is at 366.
First, in regards to the volatility over the last few sessions. Some pundits are espousing “this is what happens in negative gamma environments”, but through our lens the S&P only slightly overshot on Wednesday (aided by the drop in rates), and unwound that froth yesterday. We just did a round-trip back to 4400. We say this as to temper emotions relating to yesterdays selling. This is not to say markets cannot go lower today, just to suggest that yesterday was not as “full scorched earth” as the headline read.
While gamma positioning largely relies on open interest, we also have to look at what traded yesterday. In yesterdays session, there were two large waves of negative delta options flows. First, heavy 0DTE put buying, mixed with some 0DTE call selling on the open >4,450. As the SPX retreated back toward SPY440/SPX4400 those flows lightened up, as indicated by the red lines. Then, around 2:30PM ET we saw very heavy “all expiration” (aka non-0DTE) put flows pick up, and we believe this is what led to the closing plunge <4,400.
From a volume perspective 54% of total SPX volume yesterday was 0DTE, with another 15% occurring in the 1DTE. When we look at material changes in open interest, it reads like a lot of small hedges for tail risk around Powell. The big hedging guns didn’t come out.
Backing this idea, from an IV perspective, vols are only fractionally elevated above that of yesterday (grey). This can be seen in the fixed strike skew plot, below. This suggests that while yesterday did draw out a rather large intraday decline, it didn’t drive vol materially higher. Yes, the VIX did shift up tp 17, but that was where it closed on Tuesday.
The pop higher in VIX is driven by the “fixed strike slide”. Take a look at the IV change for the SPX 30 DTE option Wed (pink) vs yesterday(grey) – there is essentially no change. On Wednesday night the SPX closed at 4,435 with an ATM IV of ~13.5%. As the SPX dropped sharply to 4,375 yesterday, that ATM IV slid up to 14.6%. In a fear-heavy situation one would have expected the 4,375 IV to increase materially day/day, but it did not happen.
You can also frame this as the VIX just went round-trip back to 17.
Our point here is this:
One should not read too much into the movement of the last few sessions, as if Powell is soft on rhetoric today we could see a pop higher in markets as the event volatility drains off (see yesterdays note). This may lead to a test of 4,500 for next week. Should the SPX recover 4,400 into today’s close we’d favor this scenario.
Conversely, to the downside we are still under the idea that if Powell does spark a selloff, there may be a sharp initial reaction & vol pop, but downside may be padded by the gamma positioning as we approach 4,300 (again, outlined in yesterdays note). A selloff in this scenario may look a light like that of August wherein equities grind lower, but vols don’t march materially higher (after the initial reaction). This is also being reflected in our volatility/range model which maintains tight intraday forecasts.
This may matter for how you hedge in that you likely want to be more focused on short delta vs long vega. For example if you start the session with long puts, you may wnat to turn them into put spreads if vol pops on an initial downside reaction.
SpotGamma Proprietary Levels |
SPX |
SPY |
NDX |
QQQ |
RUT |
IWM |
---|---|---|---|---|---|---|
Reference Price: |
$4376 |
$436 |
$14816 |
$361 |
$1846 |
$183 |
SpotGamma Implied 1-Day Move: |
0.76% |
0.76% |
|
|
|
|
SpotGamma Implied 5-Day Move: |
2.13% |
|
|
|
|
|
SpotGamma Volatility Trigger™: |
$4415 |
$442 |
$14600 |
$366 |
$1850 |
$190 |
Absolute Gamma Strike: |
$4400 |
$440 |
$14625 |
$360 |
$1900 |
$185 |
SpotGamma Call Wall: |
$4600 |
$460 |
$14625 |
$400 |
$1860 |
$210 |
SpotGamma Put Wall: |
$4350 |
$430 |
$12500 |
$360 |
$1750 |
$180 |
Additional Key Levels |
SPX |
SPY |
NDX |
QQQ |
RUT |
IWM |
---|---|---|---|---|---|---|
Zero Gamma Level: |
$4450 |
$446 |
$14126 |
$369 |
$1941 |
$194 |
Gamma Tilt: |
0.725 |
0.551 |
1.266 |
0.639 |
0.646 |
0.448 |
SpotGamma Gamma Index™: |
-1.896 |
-0.556 |
0.029 |
-0.187 |
-0.034 |
-0.125 |
Gamma Notional (MM): |
‑$892.109M |
‑$2.289B |
$3.432M |
‑$899.744M |
‑$36.20M |
‑$1.299B |
25 Day Risk Reversal: |
-0.059 |
-0.058 |
-0.047 |
-0.051 |
-0.044 |
-0.04 |
Call Volume: |
532.782K |
1.745M |
11.42K |
1.281M |
11.213K |
234.007K |
Put Volume: |
819.167K |
3.073M |
17.634K |
1.687M |
25.95K |
413.612K |
Call Open Interest: |
6.234M |
6.735M |
60.003K |
4.883M |
218.334K |
3.657M |
Put Open Interest: |
12.882M |
13.797M |
78.352K |
9.90M |
398.425K |
7.438M |
Key Support & Resistance Strikes |
---|
SPX Levels: [4500, 4450, 4400, 4300] |
SPY Levels: [445, 440, 435, 430] |
NDX Levels: [15500, 15000, 14625, 14000] |
QQQ Levels: [370, 365, 362, 360] |
SPX Combos: [(4551,82.20), (4525,80.05), (4499,83.06), (4398,82.19), (4381,85.41), (4376,92.84), (4368,82.72), (4359,94.83), (4350,98.52), (4346,93.49), (4341,92.19), (4337,85.60), (4328,90.92), (4324,93.89), (4319,90.97), (4315,75.93), (4311,79.28), (4306,95.10), (4302,98.08), (4289,85.78), (4280,77.39), (4276,86.38), (4258,89.01), (4249,95.12), (4223,82.97), (4210,89.40), (4206,77.16), (4201,97.16)] |
SPY Combos: [423.37, 453.08, 443.03, 428.61] |
NDX Combos: [14772, 14624, 14357, 14565] |
QQQ Combos: [349, 352.61, 347.91, 357.68] |
SPX Gamma Model
View All Indices Charts