Macro Theme:
Short Term Resistance: 4,500
Short Term Support: 4,425
Risk Pivot Level: 4,400
Major Range High/Resistance: 4,600 – 4,615 (SPY 460/SPX 4,600 Call Wall(s))
Major Range Low/Support: 4,300
‣ IV Ranking suggests many significant single stocks have their lowest IV’s in months, which may be an effective way to play directional movement out of 8/16 – 8/18 expiration**
‣ Current positioning suggests 4,400 would be a major interim low, with traders likely taking a directional cue from Jackson Hole on 8/24-8/26*
‣ We look for a strong directional move out of Jackson Hole on 8/24-8/26*
*updated 8/21
**updated 8/16
Founder’s Note:
Futures are flat at 4,418. 440 SPY/ 4,400 SPX is the major level on the board, with resistance above at 4,450. Support below is at 4,375 & 4,350. Our daily range estimate is at 0.77% (cash open/close).
In QQQ support is at 363 & 360, with resistance at 365 then 370.
440 SPY/4,400 SPX is the risk
pivot
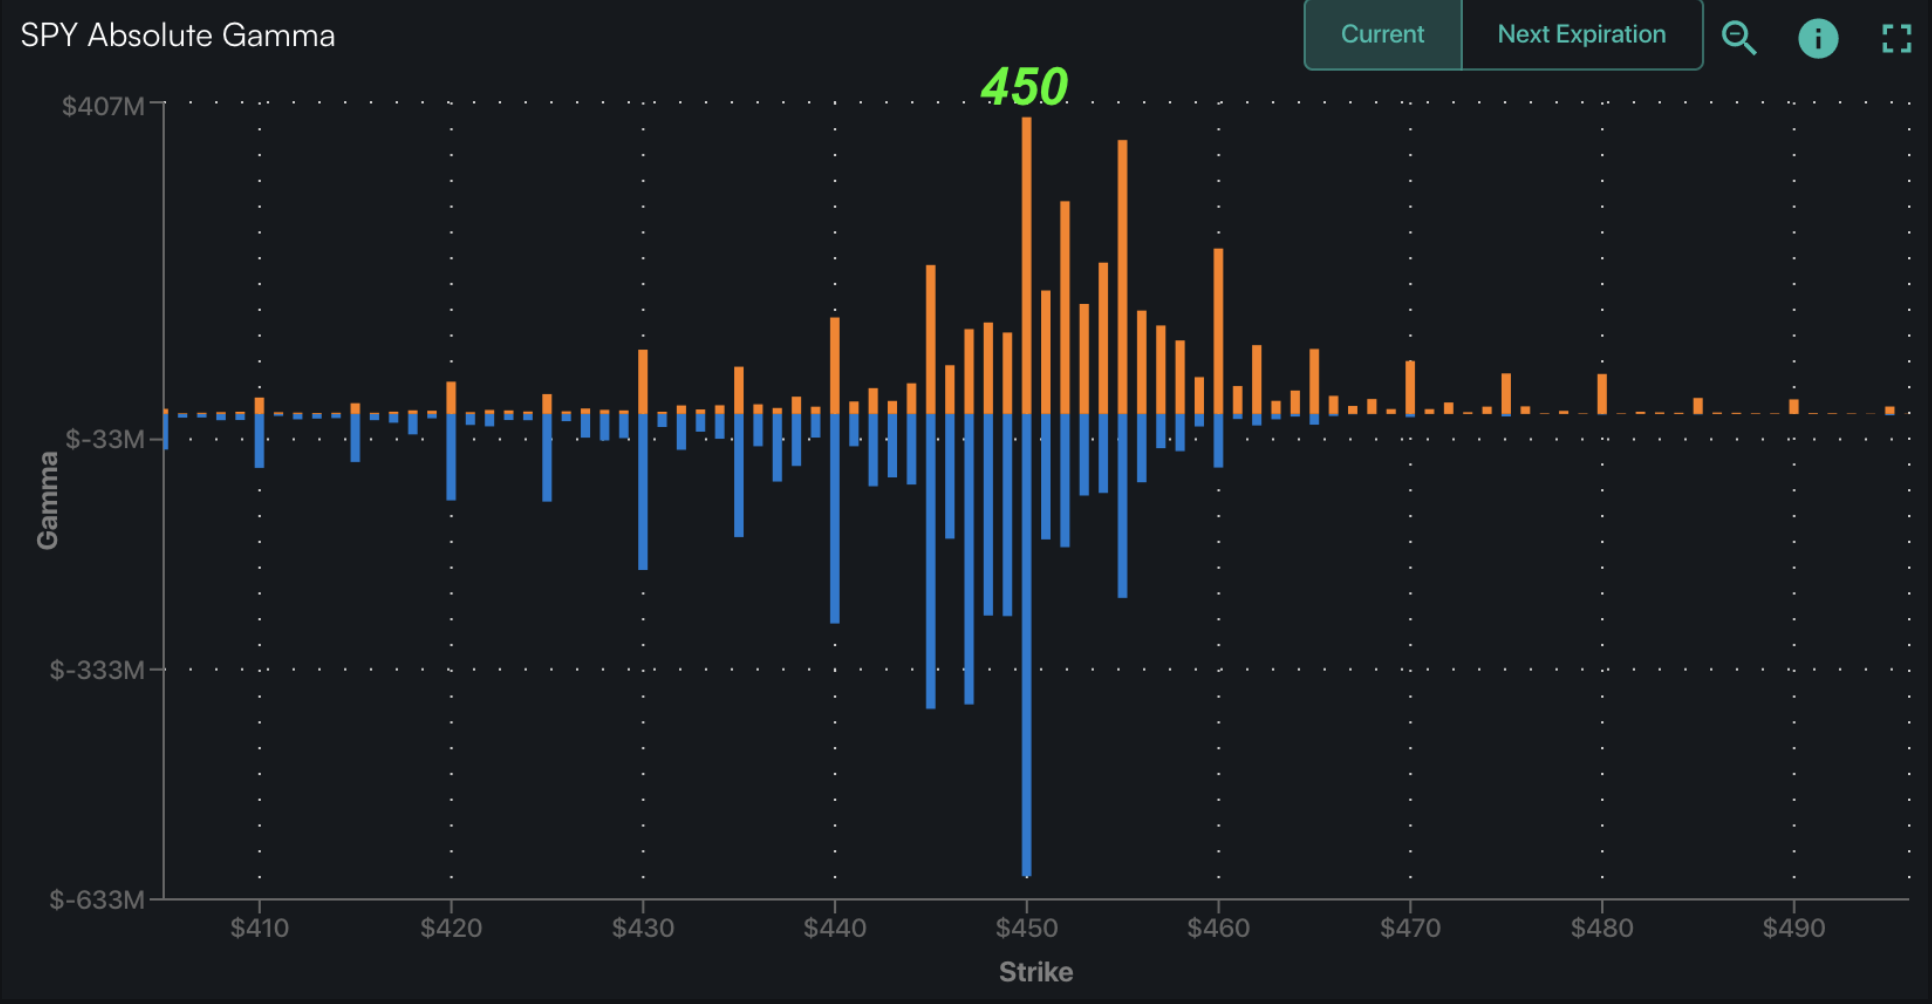
here, and the largest gamma strike on the board.

Our view from last week was that if the SPX recaptured 4,400, equity implied volatility would come in and that would work as a tailwind for equities. This morning we are indeed seeing lower implied vols, as shown below in the SPX term structure for today (pink) vs Thursday (grey). The other interesting thing here is that we have not been registering large gamma resistance levels between 440 SPY/4,400 SPX – 4,450, suggesting that a sneaky pop higher is a distinct possibility. For today, the longer the S&P holds 4,400 the more pressure we think builds for a test higher.

To the downside we still do not see a lot of room for a crash scenario. We always hesitate to state this type of view, because our worst fear is in suggest that the are nothing “clear blue skies” in equities, only to be nailed with a significant drawdown (and, nothing garners fame and attention like calling the next big crash!). That being said, we do not see clear blue skies, but we just don’t see options positioning set up to drive volatility materially higher.
To be clear, this does not mean that equities must move higher, but it does imply (based on current positioning) that if you are hedging downside you may be better off working with higher delta options vs longer dated OTM options which benefit from higher volatility/vega. Should the market be delivered unforeseen challenges (ex credit issues), that may drive downside hedging demand which would change this outlook.
Disclaimers now aside, we’ll circle back to the idea of “padded downside”. This continues to be best viewed from this gamma curve, wherein the curve bottoms around 4,300, and begins to turn higher as the SPX strike moves lower. The theory goes that as the gamma curve shifts higher, dealers delta exposure is being reduced, which alleviates downside hedging pressure.
As we’ve discussed, this model assumes dealers/MM’s are short all of the puts & long all of the calls – an extreme which cannot be true. Therefore, if this extreme model shows flattening/reduced gamma exposure <4,300 then the actual position has to be more benign. This implies lower volatility/tighter trading ranges, which is what has been reflected in our “SIV”/daily range metric (which has persistently been near 75bps/day). Further, we’d highlight those flat/lower implied vols which suggest that there is not a lot of dowside hedging demand.
With this being said, our view here is that if the market crosses back under 4,400, we’re likely to be served up with an August style decline, wherein the market grinds lower but implied volatility doesn’t materially gain.

| SpotGamma Proprietary Levels | SPX | SPY | NDX | QQQ | RUT | IWM |
|---|---|---|---|---|---|---|
| Reference Price: | $4405 | $439 | $14941 | $364 | $1853 | $184 |
| SpotGamma Implied 1-Day Move: | 0.77% | 0.77% |
|
|
|
|
| SpotGamma Implied 5-Day Move: | 2.10% |
|
|
|
|
|
| SpotGamma Volatility Trigger™: | $4415 | $440 | $14620 | $363 | $1850 | $190 |
| Absolute Gamma Strike: | $4400 | $440 | $14625 | $370 | $1900 | $185 |
| SpotGamma Call Wall: | $4600 | $460 | $14625 | $370 | $1860 | $210 |
| SpotGamma Put Wall: | $4300 | $430 | $12500 | $350 | $1750 | $180 |
| Additional Key Levels | SPX | SPY | NDX | QQQ | RUT | IWM |
|---|---|---|---|---|---|---|
| Zero Gamma Level: | $4413 | $446 | $14139 | $369 | $1993 | $195 |
| Gamma Tilt: | 0.821 | 0.646 | 1.315 | 0.791 | 0.658 | 0.450 |
| SpotGamma Gamma Index™: | -1.181 | -0.402 | 0.034 | -0.097 | -0.034 | -0.125 |
| Gamma Notional (MM): | ‑$475.413M | ‑$1.722B | $4.135M | ‑$548.782M | ‑$31.433M | ‑$1.309B |
| 25 Day Risk Reversal: | -0.048 | -0.052 | -0.048 | -0.041 | -0.038 | -0.048 |
| Call Volume: | 524.772K | 1.705M | 8.363K | 1.135M | 11.832K | 214.559K |
| Put Volume: | 964.622K | 3.282M | 14.128K | 1.435M | 29.862K | 594.327K |
| Call Open Interest: | 6.252M | 6.488M | 60.621K | 4.783M | 219.665K | 3.528M |
| Put Open Interest: | 12.755M | 13.552M | 79.12K | 9.567M | 400.136K | 7.405M |
| Key Support & Resistance Strikes |
|---|
| SPX Levels: [4500, 4450, 4400, 4300] |
| SPY Levels: [445, 440, 435, 430] |
| NDX Levels: [15500, 15000, 14625, 14000] |
| QQQ Levels: [370, 365, 360, 350] |
| SPX Combos: [(4600,93.23), (4573,77.69), (4551,87.99), (4525,88.69), (4498,93.76), (4476,86.27), (4450,84.07), (4406,79.11), (4401,94.45), (4375,95.24), (4370,75.71), (4366,83.86), (4362,76.38), (4357,83.13), (4348,96.98), (4344,84.62), (4340,82.83), (4335,78.72), (4331,76.72), (4326,93.60), (4304,93.71), (4300,97.56), (4287,74.75), (4278,81.62), (4274,74.19), (4256,81.10), (4252,94.35), (4225,85.25), (4212,87.54), (4199,96.63)] |
| SPY Combos: [437.31, 432.47, 422.35, 427.19] |
| NDX Combos: [14628, 14359, 14777, 14568] |
| QQQ Combos: [363.04, 359.4, 352.85, 357.94] |
SPX Gamma Model
View All Indices Charts