Macro Theme:
Key dates ahead:
- 11/19: VIX Exp, NVDA ER
- 11/21: OPEX
SG Summary:
UPDATE 11/17: VIX Exp is Wed AM, and we could make the case for a sneaky vol decline & equity support into tomorrow afternoon as traders roll out NOV VIX calls. Given this, we are going to be looking to add a few cheap upside call structures for Tuesday PM (spreads or flies as calls are not particularly cheap), which would profit if the SPX moves >=6,800.
11/10: With the government shutdown apparently ending we are adjusting our risk-on pivot from 6,900 to 6,800. We think the week of 11/10 is setting up to be a bullish one, with more eyes now on 11/19 NVDA ER.
Key SG levels for the SPX are:
- Resistance: 6,800
- Pivot: 6,800 (bearish <, bullish >)
- Support: 6,700, 6,600, 6,500
Founder’s Note:
Futures are up 25 bps after a relatively quiet weekend. There is no major data slated for release today. GOOGL is up sharply after Buffet’s stake was revealed.
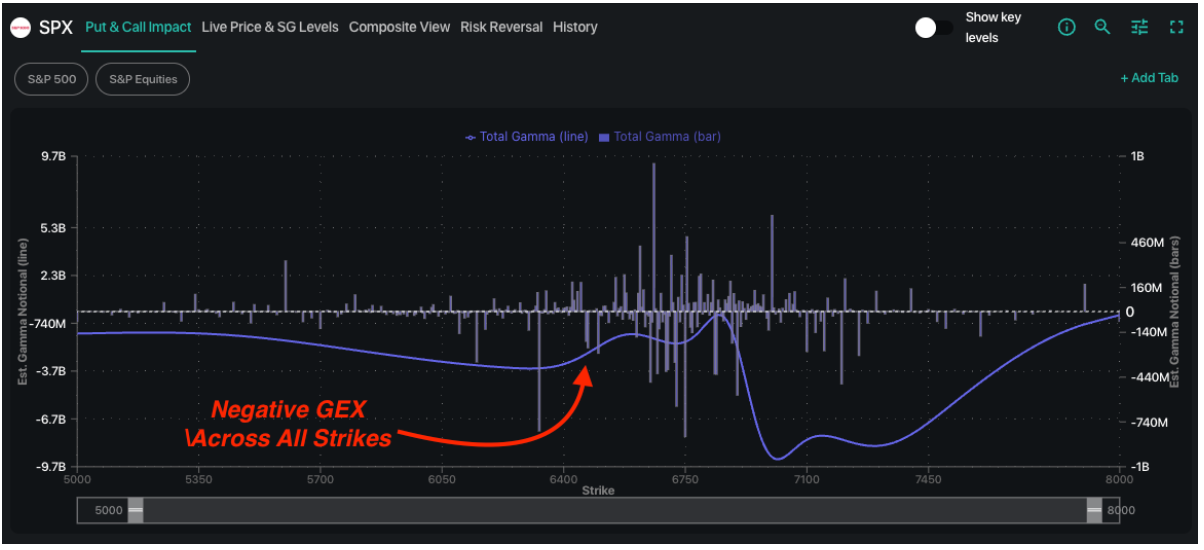
SPX gamma is negative across all strikes (purple line = GEX), but we’d expect 0DTE traders to come and and offer some options, adding positive gamma around 6,700 (support) & 6,800 (resistance). The idea being that the big move is likely Wed PM & NVDA, and so 0DTE is free to step up.
VIX Exp is also Wed AM, and we could make the case for a sneaky vol decline & equity support into tomorrow afternoon as traders roll out NOV VIX calls. At this point, what is going to spike VIX before Wed AM settlement? Given this, we are going to be looking to add a few cheap upside call structures for Tuesday PM (spreads or flies as calls are not particularly cheap), which would profit if the SPX moves >=6,800.
This is pure open interest for the VIX, and you can see roughly 1/2 of VIX OI is set to expire Wednesday AM. Obviously the vast majority of VIX “gamma” (i.e. vol firepower) is crowded into this next expiration. The time decay is heavy on these options…
On the topic of expensive options, single stock puts are sliding higher with most names falling into the bottom left of Compass. This is a critical insight into NVDA earnings, wherein any meet or beat can lead to a loss in expected downside for many of the names on this plot. Puts for sale adds upside fuel to equities. Further, after NVDA reports, traders are going to be looking at the Thanksgiving week – and people don’t love paying holiday time decay. This incentives short vol trading.
On this point, for the downside, if you own puts in these single stocks then you are dependent on an NVDA miss and/or some other significant negative data/event.
©2025 TenTen Capital LLC DBA SpotGamma
All TenTen Capital LLC DBA SpotGamma materials, information, and presentations are for educational purposes only and should not be considered specific investment advice nor recommendations. Futures, foreign currency and options trading contains substantial risk and is not for every investor. An investor could potentially lose all or more than the initial investment. Risk capital is money that can be lost without jeopardizing one’s financial security or lifestyle. Only risk capital should be used for trading and only those with sufficient risk capital should consider trading. Past performance is not necessarily indicative of future results. VIEW FULL RISK DISCLOSURE https://spotgamma.com/model-faq/disclaimer/
|
| /ESZ25 | SPX | SPY | NDX | QQQ | RUT | IWM |
|---|---|---|---|---|---|---|---|
| Reference Price: | $6755.37 | $6734 | $671 | $25008 | $608 | $2388 | $237 |
| SG Gamma Index™: |
| -0.55 | -0.336 |
|
|
|
|
| SG Implied 1-Day Move: |
| 0.65% | 0.65% |
|
|
|
|
| SG Implied 5-Day Move: |
| 1.45% |
|
|
|
|
|
| SG Implied 1-Day Move High: |
| After open | After open |
|
|
|
|
| SG Implied 1-Day Move Low: |
| After open | After open |
|
|
|
|
| SG Volatility Trigger™: | $6791.37 | $6770 | $673 | $24590 | $615 | $2440 | $240 |
| Absolute Gamma Strike: | $6021.37 | $6000 | $670 | $24500 | $600 | $2400 | $240 |
| Call Wall: | $7021.37 | $7000 | $700 | $24600 | $640 | $2450 | $250 |
| Put Wall: | $6671.37 | $6650 | $660 | $24000 | $600 | $2390 | $235 |
| Zero Gamma Level: | $6766.37 | $6745 | $675 | $24944 | $616 | $2474 | $248 |
| Key Support & Resistance Strikes |
|---|
| SPX Levels: [6000, 6800, 6700, 7000] |
| SPY Levels: [670, 640, 660, 680] |
| NDX Levels: [24500, 24600, 25000, 25500] |
| QQQ Levels: [600, 610, 590, 620] |
| SPX Combos: [(7051,89.74), (7017,79.11), (6997,99.11), (6977,89.13), (6970,72.32), (6956,73.33), (6950,94.55), (6923,84.35), (6916,83.26), (6902,71.83), (6896,98.47), (6882,69.80), (6876,90.10), (6862,80.67), (6849,94.59), (6842,75.20), (6835,72.95), (6822,89.34), (6815,74.46), (6801,96.06), (6788,78.56), (6727,88.54), (6721,83.53), (6714,80.04), (6707,72.84), (6700,94.47), (6694,76.46), (6687,81.44), (6680,70.02), (6674,72.35), (6667,94.23), (6660,91.05), (6653,70.49), (6647,97.15), (6626,87.81), (6613,88.38), (6606,79.22), (6599,93.54), (6586,77.34), (6572,78.45), (6566,79.03), (6546,86.02), (6532,75.54), (6525,72.42), (6512,86.75), (6498,95.06), (6471,84.08), (6465,81.74), (6451,83.90), (6411,80.10)] |
| SPY Combos: [698.26, 688.18, 668.02, 693.56] |
| NDX Combos: [24658, 24583, 24233, 24433] |
| QQQ Combos: [599.87, 598.65, 590.13, 595] |

0 comentarios