
Macro Theme:
Short Term SPX Resistance: 4,300
Short Term SPX Support: 4,200
SPX Risk Pivot Level: 4,315
Major SPX Range High/Resistance: 4,400
Major SPX Range Low/Support: 4,200
‣ <4,200 SPX may mark a sharp increase in volatility*
*updated 10/4
Founder’s Note:
ES Futures are flat at 4,365. Key SG levels for the SPX are:
- Support: 4,213, 4,200
- Resistance: 4,250, 4,300
- 1 Day Implied Range: 0.81%
For QQQ, support is at 350, with resistance at 355 & 360. Its of note that despite these lower markets over the last several days, the Put Walls for QQQ/SPY/SPX have stayed stationary at 350/420/4,200. SPY 420 is labeled below, and as you can see its a very large level (as are the other Put Walls). This implies that these levels should function as support, but the issue here is that we need something to break the negative, reflexive feedback loop. Without that break the Put Walls will likely come under pressure.

This was a similar issue into last week – there was a downside pressure on the market and we felt that Friday’s OPEX was an opportunity to snap the negative gamma/vanna cycle, and bring a relief rally to markets. That failed to materialize, as yields jumped higher, with yesterday’s JOLTS numbers feeding into the “higher for longer” rate narrative. Today at 10AM ET we have ISM, which may trigger similar market movement.
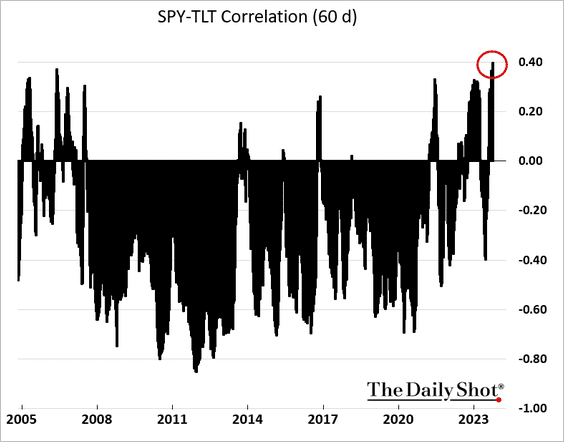
Rates are not only dominating headlines & discussions, but they are also generating high short term correlations with equities, like the one posted below. For the time being, yields (and their rate of change) is going to dictate equity direction, as we are now, in a way, trading rates. However, thus far, we’d argue they are not dictating equity volatility. That would change if these higher rates break things, and force margin calls and/or other liquidations.
Before we delve in further, as we’ve said a handful of times over the years, what causes us the greatest consternation is suggesting that equities are “all clear” just before stocks plunge, and the VIX goes to 50. We’ve had a fair amount of anxiety around this topic recently as we’ve been calling for equities to “grind down” vs “plunge” (see yesterday, for example).
Certainly, yesterday AM felt “plungy” as the SPX dropped ~60 handles from its highs, but right around 11:30, as the VIX tested 20, the SPX hit the lower bound of our 1 day range (4,233), and the EU closed. The market then flatlined.

This general phenomenon is not new, either. Consider the last 5 sessions, wherein we’ve highlighted our 1 Day SG Implied Move (open-close range). This range is a gamma derived metric, and it has been sticky in the ~0.82% since the end of Sep. As you can see, many of the recent S&P moves are sharp into mid-day, sometimes breaching the 1day range, but then reverting back “into the box”. Through this lens, and as mentioned above, we view rates & macro as currently dictating direction, but options controlling volatility. Further, despite the ~20 VIX, realized volatility is acting within expectations.
Also note the model behind the SG Implied Move is unchanged since the launch of daily expirations, and so we do not think this failure of volatility to “launch” is due to 0DTE.
Why does this matter? Well, if you are full up on puts and expecting the end of the world *today*, or your short futures playing for a -1.5% intraday move, this model would advise that magnitude of selling is not yet on the table. It also matters for wherein we could look for the “grind” turn into a “plunge”, and odds of 1.5% moves increase.

Heading into this week we thought that 4,200 was a likely lower bound for stocks, due to the options market positioning. Over the last few sessions, we are seeing put interest increase at strikes below, and that is starting to push down our lower bound.
To this point, the “trough” in the gamma curve (green box) is now down in the 4,125 area, from closer to 4,200 last week. Therefore, if we break 4,200, we’d likely see our daily 1 day range estimates jump towards 1%, and realized volatility increase (for more on the gamma curve dynamics, read our 9/19 note, here).
If rates continue their pace of increase its going to keep the pressure on stocks, and <=4,200 is where the pace of equity decline could increase, which corresponds with higher vol-of-vol. That would be “plungy”.

Seeing both sides, its important to note that a little yield-relief could draw an outsized, upside response from equities. This is because there is a lot of gamma & vanna firepower to ramp stocks – and the inevitable short covering rally likely becomes leading pundits to shout “this is ridiculous, who is buying this?!?”.
As noted above, this turning point or spark for that rally is likely data-driven, which magnifies the importance of various data points. ISM today is a smaller event, but traders will be watching Friday’s NFP and next weeks FOMC Mins + CPI. As you can see in the term structure below, IV’s are elevated for these dates which suggests options traders are marking associated higher volatility due to these data prints.

| SpotGamma Proprietary Levels | SPX | SPY | NDX | QQQ | RUT | IWM |
|---|---|---|---|---|---|---|
| Reference Price: | $4229 | $421 | $14565 | $354 | $1727 | $171 |
| SpotGamma Implied 1-Day Move: | 0.81% | 0.81% |
|
|
|
|
| SpotGamma Implied 5-Day Move: | 2.27% |
|
|
|
|
|
| SpotGamma Volatility Trigger™: | $4350 | $430 | $15025 | $360 | $1805 | $185 |
| Absolute Gamma Strike: | $4000 | $420 | $15250 | $350 | $1800 | $175 |
| SpotGamma Call Wall: | $4450 | $455 | $15250 | $380 | $1850 | $210 |
| SpotGamma Put Wall: | $4200 | $420 | $14000 | $350 | $1700 | $170 |
| Additional Key Levels | SPX | SPY | NDX | QQQ | RUT | IWM |
|---|---|---|---|---|---|---|
| Zero Gamma Level: | $4333 | $433 | $14638 | $365 | $1857 | $187 |
| Gamma Tilt: | 0.582 | 0.492 | 0.880 | 0.587 | 0.427 | 0.317 |
| SpotGamma Gamma Index™: | -2.647 | -0.557 | -0.015 | -0.191 | -0.046 | -0.131 |
| Gamma Notional (MM): | ‑$1.264B | ‑$2.582B | ‑$2.381M | ‑$1.022B | ‑$51.503M | ‑$1.454B |
| 25 Day Risk Reversal: | -0.042 | -0.038 | -0.044 | -0.048 | -0.041 | -0.028 |
| Call Volume: | 742.833K | 2.324M | 7.855K | 1.042M | 39.012K | 443.941K |
| Put Volume: | 1.269M | 3.337M | 12.191K | 1.304M | 59.137K | 1.218M |
| Call Open Interest: | 6.419M | 7.228M | 53.495K | 4.616M | 196.233K | 3.188M |
| Put Open Interest: | 12.008M | 11.798M | 82.287K | 8.147M | 353.297K | 6.527M |
| Key Support & Resistance Strikes |
|---|
| SPX Levels: [4400, 4300, 4200, 4000] |
| SPY Levels: [430, 425, 420, 415] |
| NDX Levels: [15500, 15250, 15000, 14500] |
| QQQ Levels: [360, 355, 350, 345] |
| SPX Combos: [(4399,91.06), (4373,75.25), (4314,76.34), (4301,97.01), (4280,79.21), (4276,84.44), (4272,83.61), (4263,83.38), (4251,97.89), (4234,85.52), (4225,93.84), (4221,84.08), (4213,93.18), (4208,81.53), (4204,83.33), (4200,99.86), (4191,87.48), (4183,85.74), (4179,80.90), (4174,90.88), (4170,82.86), (4162,93.13), (4149,97.30), (4141,77.30), (4124,90.95), (4111,86.82), (4098,98.97), (4073,86.65), (4060,76.58), (4056,74.78), (4052,93.30), (4026,75.37)] |
| SPY Combos: [412.82, 422.95, 403.13, 417.88] |
| NDX Combos: [14362, 14158, 14566, 15250] |
| QQQ Combos: [364.56, 343.64, 338.68, 348.61] |
0 comentarios